
Seller's Agent in 2025
Jeremy White
BHHS Verani Concord
(603) 573-5353
7 in this area
162 Total Sales
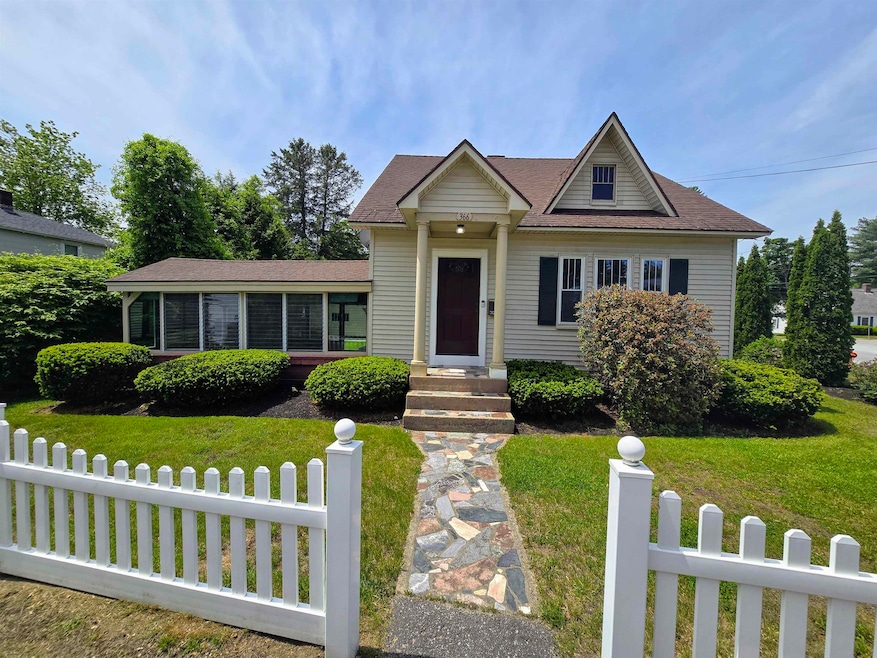
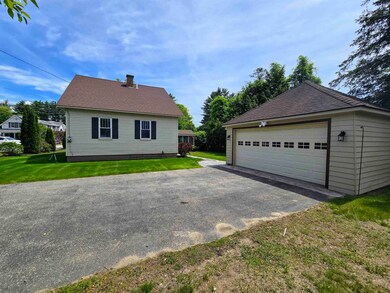

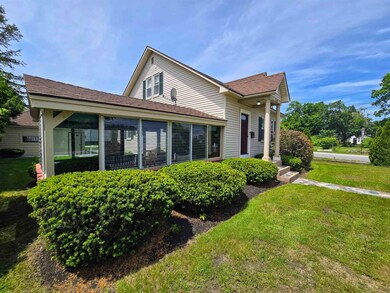
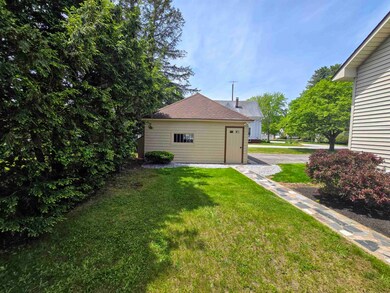
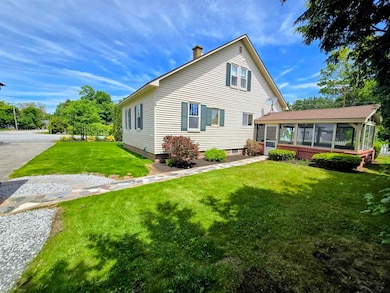
Welcome to this delightful South End Cape, perfectly situated within walking distance to Rollins Park. It has a great floor plan with a central kitchen, dining room, and living room along with two bedrooms and a bathroom all located on the main floor. Featuring hardwood floors, walk-in showers, a finished basement bonus room with natural gas stove and lots of natural light. There have also been a number of recent upgrades including kitchen, bathroom and bedroom renovations. With a large paved driveway that provides plenty of off-street parking and a detached two car garage you will love the extra convenience and functionality. This well-maintained home combines comfort, convenience, and charm not far from schools and downtown Concord. Don’t miss your opportunity to make it yours! Schedule your showing today! Please note an offer deadline has been set for Monday at 5pm.
Last Agent to Sell the Property
BHHS Verani Concord Brokerage Phone: 603-573-5353 License #075637 Listed on: 05/29/2025
| Date | Type | Sale Price | Title Company |
|---|---|---|---|
| Warranty Deed | $450,000 | -- | |
| Warranty Deed | $450,000 | -- | |
| Deed | -- | -- | |
| Deed | -- | -- |
| Date | Status | Loan Amount | Loan Type |
|---|---|---|---|
| Open | $441,849 | Purchase Money Mortgage | |
| Closed | $441,849 | New Conventional |
| Date | Event | Price | List to Sale | Price per Sq Ft |
|---|---|---|---|---|
| 07/03/2025 07/03/25 | Sold | $450,000 | +12.5% | $266 / Sq Ft |
| 06/03/2025 06/03/25 | Pending | -- | -- | -- |
| 05/29/2025 05/29/25 | For Sale | $399,900 | -- | $237 / Sq Ft |
| Year | Tax Paid | Tax Assessment Tax Assessment Total Assessment is a certain percentage of the fair market value that is determined by local assessors to be the total taxable value of land and additions on the property. | Land | Improvement |
|---|---|---|---|---|
| 2024 | $7,241 | $261,500 | $93,800 | $167,700 |
| 2023 | $7,024 | $261,500 | $93,800 | $167,700 |
| 2022 | $6,770 | $261,500 | $93,800 | $167,700 |
| 2021 | $6,569 | $261,500 | $93,800 | $167,700 |
| 2020 | $6,481 | $242,200 | $78,400 | $163,800 |
| 2019 | $6,073 | $218,600 | $74,900 | $143,700 |
| 2018 | $5,475 | $194,200 | $74,900 | $119,300 |
| 2017 | $5,303 | $187,800 | $73,600 | $114,200 |
| 2016 | $4,964 | $179,400 | $73,600 | $105,800 |
| 2015 | $4,790 | $171,700 | $66,900 | $104,800 |
| 2014 | $4,603 | $171,700 | $66,900 | $104,800 |
| 2013 | -- | $168,900 | $66,900 | $102,000 |
| 2012 | -- | $170,200 | $66,900 | $103,300 |
Seller's Agent in 2025
Jeremy White
BHHS Verani Concord
(603) 573-5353
7 in this area
162 Total Sales
H
Buyer's Agent in 2025
Heather Goodwin
EXP Realty
(888) 398-7062
1 in this area
32 Total Sales
Buyer Co-Listing Agent in 2025
Dempsey Realty Group
EXP Realty
(603) 661-5529
5 in this area
412 Total Sales
Source: PrimeMLS
MLS Number: 5043407
APN: CNCD-000004-000002-000009
Disclaimer: Certain information contained herein is derived from information provided by parties other than Homes.com. All information provided is deemed reliable, but is not guaranteed to be accurate and should be independently verified.
![]() Copyright 2025 PrimeMLS, Inc. All rights reserved. This information is deemed reliable, but not guaranteed. The data relating to real estate displayed on this display comes in part from the IDX Program of PrimeMLS. The information being provided is for consumers’ personal, non-commercial use and may not be used for any purpose other than to identify prospective properties consumers may be interested in purchasing.
Copyright 2025 PrimeMLS, Inc. All rights reserved. This information is deemed reliable, but not guaranteed. The data relating to real estate displayed on this display comes in part from the IDX Program of PrimeMLS. The information being provided is for consumers’ personal, non-commercial use and may not be used for any purpose other than to identify prospective properties consumers may be interested in purchasing.