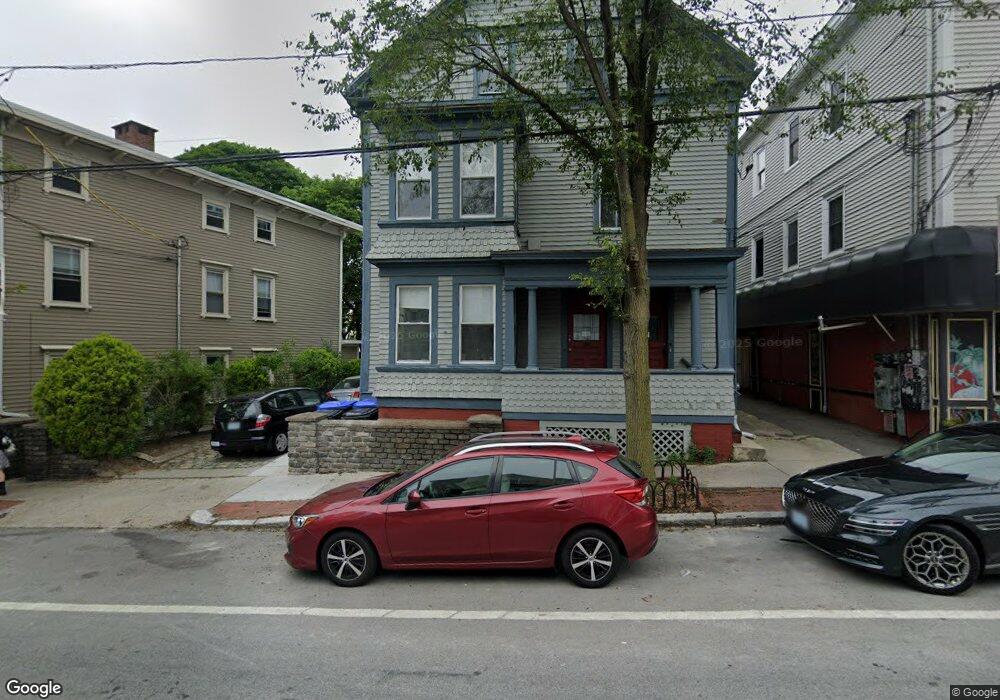
366 Wickenden St Providence, RI 02903
Fox Point NeighborhoodEstimated Value: $846,000 - $1,068,631
6
Beds
2
Baths
2,640
Sq Ft
$364/Sq Ft
Est. Value
About This Home
This home is located at 366 Wickenden St, Providence, RI 02903 and is currently estimated at $961,408, approximately $364 per square foot. 366 Wickenden St is a home located in Providence County with nearby schools including French-American School of Rhode Island, Wheeler School, and Moses Brown School.
Ownership History
Date
Name
Owned For
Owner Type
Purchase Details
Closed on
Mar 28, 2022
Sold by
Twigg Daniel W
Bought by
Mcneary Anna and Mcneary Nathan Jacob
Current Estimated Value
Home Financials for this Owner
Home Financials are based on the most recent Mortgage that was taken out on this home.
Original Mortgage
$559,614
Outstanding Balance
$521,487
Interest Rate
3.69%
Mortgage Type
FHA
Estimated Equity
$439,921
Create a Home Valuation Report for This Property
The Home Valuation Report is an in-depth analysis detailing your home's value as well as a comparison with similar homes in the area
Home Values in the Area
Average Home Value in this Area
Purchase History
| Date | Buyer | Sale Price | Title Company |
|---|---|---|---|
| Mcneary Anna | $611,100 | None Available |
Source: Public Records
Mortgage History
| Date | Status | Borrower | Loan Amount |
|---|---|---|---|
| Open | Mcneary Anna | $559,614 |
Source: Public Records
Tax History
| Year | Tax Paid | Tax Assessment Tax Assessment Total Assessment is a certain percentage of the fair market value that is determined by local assessors to be the total taxable value of land and additions on the property. | Land | Improvement |
|---|---|---|---|---|
| 2025 | $12,690 | $906,400 | $520,300 | $386,100 |
| 2024 | $10,696 | $582,900 | $312,800 | $270,100 |
| 2023 | $10,696 | $582,900 | $312,800 | $270,100 |
| 2022 | $10,376 | $582,900 | $312,800 | $270,100 |
| 2021 | $9,981 | $406,400 | $231,500 | $174,900 |
| 2020 | $9,981 | $406,400 | $231,500 | $174,900 |
| 2019 | $9,981 | $406,400 | $231,500 | $174,900 |
| 2018 | $10,432 | $326,400 | $210,400 | $116,000 |
| 2017 | $10,432 | $326,400 | $210,400 | $116,000 |
| 2016 | $10,432 | $326,400 | $210,400 | $116,000 |
| 2015 | $10,165 | $307,100 | $203,000 | $104,100 |
| 2014 | $10,365 | $307,100 | $203,000 | $104,100 |
| 2013 | $10,196 | $302,100 | $203,000 | $99,100 |
Source: Public Records
Map
Nearby Homes
- 185 Transit St
- 374 Wickenden St
- 323 Wickenden St
- 427 Wickenden St
- 16 Governor St
- 20 Governor St
- 84 Transit St
- 42 E Transit St
- 42 Fremont St
- 555 S Main St Unit 321
- 38 Transit St Unit 3
- 555 S Water St Unit 212
- 670 Wickenden St
- 388 S Main St Unit 66
- 14 Amy St
- 18 Amy St
- 45 E George St
- 165 Waterman St Unit 2
- 355 Angell St Unit 7
- 124 Pitman St
- 356 Wickenden St Unit 3rd
- 356 Wickenden St
- 354 Wickenden St
- 354 Wickenden St Unit 2R
- 354 Wickenden St Unit 1L
- 354 Wickenden St Unit 1R
- 354 Wickenden St Unit 2L
- 354 Wickenden St Unit 2R
- 354 Wickenden St Unit 3
- 133 Sheldon St
- 127 Sheldon St
- 129 Sheldon St Unit 1L
- 382 Wickenden St
- 54 Hope St
- 54 Hope St Unit 1
- 123 Sheldon St
- 0 Hope St Unit 821402
- 0 Hope St Unit 1024664
- 0 Hope St Unit 1037093
- 365 Wickenden St
Your Personal Tour Guide
Ask me questions while you tour the home.