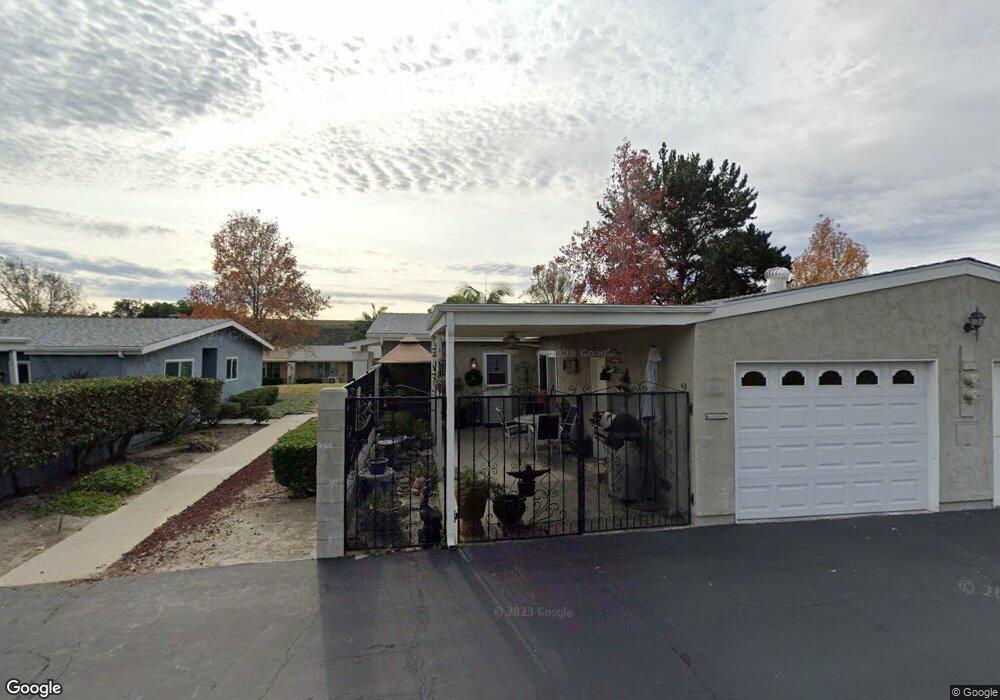
3661 Brandywine St Oceanside, CA 92057
Oceana NeighborhoodEstimated Value: $427,925 - $464,000
2
Beds
2
Baths
1,050
Sq Ft
$430/Sq Ft
Est. Value
About This Home
This home is located at 3661 Brandywine St, Oceanside, CA 92057 and is currently estimated at $450,981, approximately $429 per square foot. 3661 Brandywine St is a home located in San Diego County with nearby schools including San Luis Rey Elementary School, Martin Luther King Jr. Middle School, and El Camino High School.
Ownership History
Date
Name
Owned For
Owner Type
Purchase Details
Closed on
Oct 30, 2020
Sold by
Parker Overstreet Susan H and The Susan H Parker Overstreet
Bought by
Parker Susan H and Susan H Parker Trust
Current Estimated Value
Purchase Details
Closed on
Jul 18, 2011
Sold by
Parker Overstreet Susan H
Bought by
Parker Overstreet Susan H
Purchase Details
Closed on
Oct 18, 2005
Sold by
Parker Overstreet Susan H and Parker Susan H
Bought by
Overstreet Clark H and Parker Overstreet Susan H
Home Financials for this Owner
Home Financials are based on the most recent Mortgage that was taken out on this home.
Original Mortgage
$140,000
Outstanding Balance
$74,556
Interest Rate
5.68%
Mortgage Type
Stand Alone Refi Refinance Of Original Loan
Estimated Equity
$376,425
Purchase Details
Closed on
May 8, 2002
Sold by
Vogle Jacqueline L A
Bought by
Parker Susan H
Home Financials for this Owner
Home Financials are based on the most recent Mortgage that was taken out on this home.
Original Mortgage
$114,000
Interest Rate
6.86%
Create a Home Valuation Report for This Property
The Home Valuation Report is an in-depth analysis detailing your home's value as well as a comparison with similar homes in the area
Home Values in the Area
Average Home Value in this Area
Purchase History
| Date | Buyer | Sale Price | Title Company |
|---|---|---|---|
| Parker Susan H | -- | None Available | |
| Parker Overstreet Susan H | -- | None Available | |
| Overstreet Clark H | -- | First Southwestern Title | |
| Parker Susan H | $142,500 | Old Republic Title Company |
Source: Public Records
Mortgage History
| Date | Status | Borrower | Loan Amount |
|---|---|---|---|
| Open | Overstreet Clark H | $140,000 | |
| Previous Owner | Parker Susan H | $114,000 |
Source: Public Records
Tax History Compared to Growth
Tax History
| Year | Tax Paid | Tax Assessment Tax Assessment Total Assessment is a certain percentage of the fair market value that is determined by local assessors to be the total taxable value of land and additions on the property. | Land | Improvement |
|---|---|---|---|---|
| 2025 | $2,235 | $206,371 | $101,375 | $104,996 |
| 2024 | $2,235 | $202,326 | $99,388 | $102,938 |
| 2023 | $2,165 | $198,360 | $97,440 | $100,920 |
| 2022 | $2,131 | $194,472 | $95,530 | $98,942 |
| 2021 | $2,137 | $190,659 | $93,657 | $97,002 |
| 2020 | $2,071 | $188,705 | $92,697 | $96,008 |
| 2019 | $2,011 | $185,006 | $90,880 | $94,126 |
| 2018 | $1,988 | $181,380 | $89,099 | $92,281 |
| 2017 | $1,950 | $177,824 | $87,352 | $90,472 |
| 2016 | $1,885 | $174,339 | $85,640 | $88,699 |
| 2015 | $1,830 | $171,721 | $84,354 | $87,367 |
| 2014 | $1,760 | $168,358 | $82,702 | $85,656 |
Source: Public Records
Map
Nearby Homes
- 3631 Brandywine St
- 3676 Bartlett Ave
- 3594 Pear Blossom Dr
- 3577 Pear Blossom Ave
- 3621 Vista Campana S Unit 64
- 3621 Vista Campana S Unit 95
- 3621 Vista Campana S Unit 11
- 3621 Vista Campana S Unit 56
- 3760 Vista Campana S Unit 48
- 3760 Vista Campana S Unit 76
- 3760 Vista Campana S Unit 15
- 3760 Vista Campana S Unit 81
- 3630 Vista Campana S Unit 6
- 3625 Vista Oceana Unit 1
- 3685 Vista Campana N Unit 62
- 3685 Vista Campana N Unit 58
- 3685 Vista Campana N
- 3685 Vista Campana N Unit 16
- 3808 Vista Campana S Unit 42
- 3808 Vista Campana S Unit 38
- 3655 Brandywine St
- 3649 Brandywine St Unit 3
- 3643 Brandywine St
- 3679 Brandywine St
- 3662 Mount Vernon Ave Unit 3
- 3662 Mount Vernon Ave
- 3668 Mount Vernon Ave
- 3674 Mount Vernon Ave
- 3650 Mount Vernon Ave
- 3680 Mount Vernon Ave
- 3685 Brandywine St
- 3625 Brandywine St
- 3686 Mount Vernon Ave
- 3644 Mount Vernon Ave
- 3632 Mount Vernon Ave
- 3686 Kieffer St
- 3626 Mount Vernon Ave
- 3691 Brandywine St
- 3680 Kieffer St
- 3652 Bartlett Ave