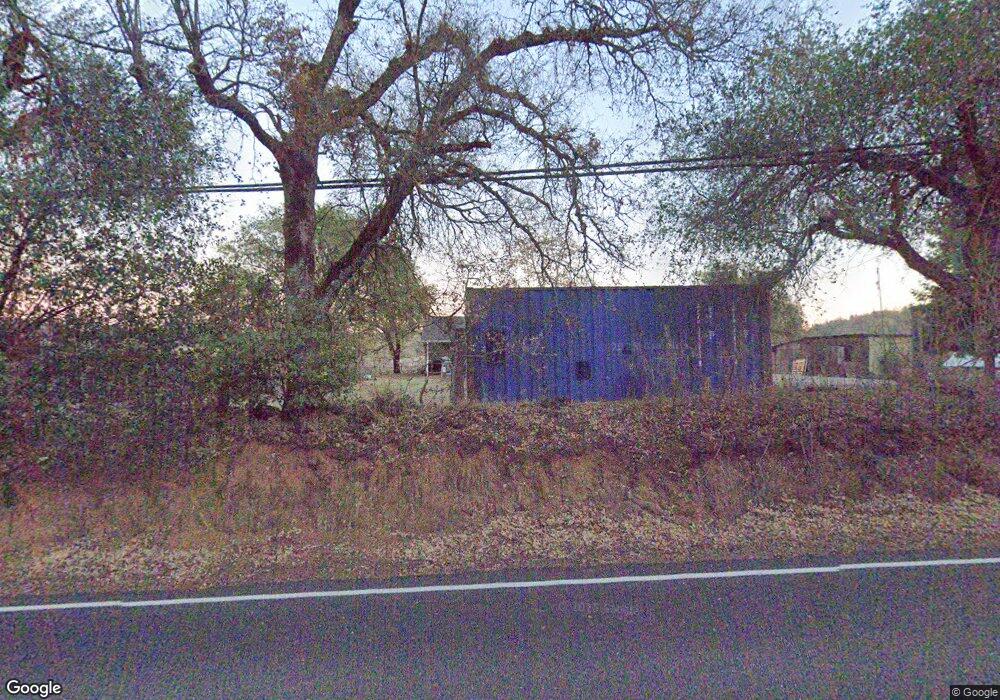
3661 N Shingle Rd Shingle Springs, CA 95682
Estimated Value: $364,000 - $569,000
3
Beds
1
Bath
1,026
Sq Ft
$455/Sq Ft
Est. Value
About This Home
This home is located at 3661 N Shingle Rd, Shingle Springs, CA 95682 and is currently estimated at $466,809, approximately $454 per square foot. 3661 N Shingle Rd is a home located in El Dorado County with nearby schools including Buckeye Elementary School, Camerado Springs Middle School, and Ponderosa High School.
Ownership History
Date
Name
Owned For
Owner Type
Purchase Details
Closed on
May 28, 2024
Sold by
Hayden Living Trust and Hayden Brett
Bought by
Llamas Venancio
Current Estimated Value
Home Financials for this Owner
Home Financials are based on the most recent Mortgage that was taken out on this home.
Original Mortgage
$405,000
Outstanding Balance
$399,910
Interest Rate
7.1%
Mortgage Type
Seller Take Back
Estimated Equity
$66,899
Purchase Details
Closed on
Apr 15, 2022
Sold by
Gr Berkshire Capital Trust and Homeca Inc
Bought by
Gr Berkshire Capital Trust and Homeca Inc
Purchase Details
Closed on
Mar 30, 2022
Sold by
Manning Johnny Lee and Ashley Deliz
Bought by
Gr Berkshire Capital Trust and Homeca Inc
Purchase Details
Closed on
Aug 12, 2016
Sold by
Hayden Ronald
Bought by
Hayden Ronald
Purchase Details
Closed on
Jun 12, 2002
Sold by
Hayden Ronald and Hayden Deetta
Bought by
Hayden Ronald and Hayden Deetta
Create a Home Valuation Report for This Property
The Home Valuation Report is an in-depth analysis detailing your home's value as well as a comparison with similar homes in the area
Home Values in the Area
Average Home Value in this Area
Purchase History
| Date | Buyer | Sale Price | Title Company |
|---|---|---|---|
| Llamas Venancio | $405,000 | None Listed On Document | |
| Gr Berkshire Capital Trust | -- | None Listed On Document | |
| Gold Tag Capital Trust | -- | None Listed On Document | |
| Gr Berkshire Capital Trust | $450,000 | Inter County Title | |
| Hayden Ronald | -- | None Available | |
| Hayden Ronald | -- | -- |
Source: Public Records
Mortgage History
| Date | Status | Borrower | Loan Amount |
|---|---|---|---|
| Open | Llamas Venancio | $405,000 |
Source: Public Records
Tax History Compared to Growth
Tax History
| Year | Tax Paid | Tax Assessment Tax Assessment Total Assessment is a certain percentage of the fair market value that is determined by local assessors to be the total taxable value of land and additions on the property. | Land | Improvement |
|---|---|---|---|---|
| 2025 | $549 | $413,100 | $202,980 | $210,120 |
| 2024 | $549 | $44,329 | $23,277 | $21,052 |
| 2023 | $540 | $43,461 | $22,821 | $20,640 |
| 2022 | $533 | $42,610 | $22,374 | $20,236 |
| 2021 | $527 | $41,776 | $21,936 | $19,840 |
| 2020 | $521 | $41,349 | $21,712 | $19,637 |
| 2019 | $514 | $40,539 | $21,287 | $19,252 |
| 2018 | $502 | $39,745 | $20,870 | $18,875 |
| 2017 | $495 | $38,966 | $20,461 | $18,505 |
| 2016 | $489 | $38,203 | $20,060 | $18,143 |
| 2015 | $548 | $37,630 | $19,759 | $17,871 |
| 2014 | $548 | $36,895 | $19,373 | $17,522 |
Source: Public Records
Map
Nearby Homes
- 4101 Panadero Dr
- 4413 Vega Loop
- 4231 Idle Creek Dr
- 4225 Creekside Dr
- 3790 Ponderosa Rd
- 3449 N Shingle Rd
- 4290 Idle Creek Dr
- 3720 Whispering Pines Ln
- 4121 Shingle Springs Dr
- 8109 Bridger Ln
- 8118 Bridger Ln
- 4706 Hillwood Dr
- 4370 Hillwood Dr
- 3881 Welker Ln
- 4570 Woodside Way
- 2.49 AC Quest Ct
- 3695 Lily Ln
- 3586 Hilton Way
- 2 S Shingle Rd
- 0 Product Dr Unit 202500060
- 3714 N Shingle Rd
- 4231 Eckerman Ct
- 1 Idle Creek Dr
- 3513 N Shingle Rd
- 3511 N Shingle Rd
- 3433 N Shingle Rd
- 4257 Sunset Ln
- 4201 Eckerman Ct
- 4261 Sunset Ln
- 3700 N Shingle Rd
- 4184 Eckerman Ct
- 4211 Sunset Ln
- 4211 Sunset Ln
- 3750 N Shingle Rd
- 4300 Sunset Ln
- 4201 Foxwood Ln
- 4242 Mother Lode Dr
- 4226 Mother Lode Dr
- 4200 Foxwood Ln
- 4181 Vista Del Monte Dr