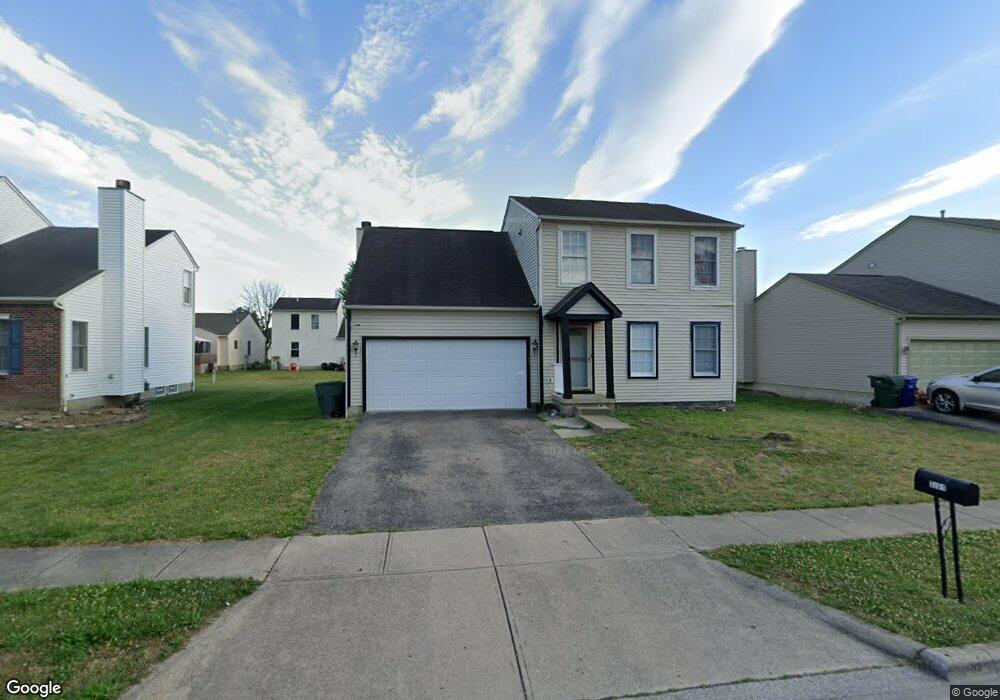
3661 Roxmore Ct Columbus, OH 43232
Glenbrook NeighborhoodEstimated Value: $267,000 - $288,212
4
Beds
3
Baths
1,883
Sq Ft
$147/Sq Ft
Est. Value
About This Home
This home is located at 3661 Roxmore Ct, Columbus, OH 43232 and is currently estimated at $277,553, approximately $147 per square foot. 3661 Roxmore Ct is a home located in Franklin County with nearby schools including Groveport Madison High School, Eastland Preparatory Academy, and Millennium Community School.
Ownership History
Date
Name
Owned For
Owner Type
Purchase Details
Closed on
Mar 11, 2021
Sold by
Chami Hajar
Bought by
Doe Dorris
Current Estimated Value
Home Financials for this Owner
Home Financials are based on the most recent Mortgage that was taken out on this home.
Original Mortgage
$171,000
Outstanding Balance
$153,367
Interest Rate
2.73%
Mortgage Type
New Conventional
Estimated Equity
$124,186
Purchase Details
Closed on
Dec 27, 2005
Sold by
Hud
Bought by
Chami Hajar
Home Financials for this Owner
Home Financials are based on the most recent Mortgage that was taken out on this home.
Original Mortgage
$110,000
Interest Rate
6.34%
Mortgage Type
Fannie Mae Freddie Mac
Purchase Details
Closed on
Mar 10, 2005
Sold by
Sali Nadina D and Eastern Savings Bank Fsb
Bought by
Hud
Purchase Details
Closed on
May 19, 2000
Sold by
Dominion Homes Inc
Bought by
Goliva Jose C and Soto Loyda B
Home Financials for this Owner
Home Financials are based on the most recent Mortgage that was taken out on this home.
Original Mortgage
$152,822
Interest Rate
8.13%
Mortgage Type
FHA
Create a Home Valuation Report for This Property
The Home Valuation Report is an in-depth analysis detailing your home's value as well as a comparison with similar homes in the area
Home Values in the Area
Average Home Value in this Area
Purchase History
| Date | Buyer | Sale Price | Title Company |
|---|---|---|---|
| Doe Dorris | $180,000 | Elite Land Title Agency | |
| Chami Hajar | $110,000 | Lakeside | |
| Hud | $96,000 | -- | |
| Goliva Jose C | $152,900 | Alliance Title |
Source: Public Records
Mortgage History
| Date | Status | Borrower | Loan Amount |
|---|---|---|---|
| Open | Doe Dorris | $171,000 | |
| Previous Owner | Chami Hajar | $110,000 | |
| Previous Owner | Goliva Jose C | $152,822 |
Source: Public Records
Tax History Compared to Growth
Tax History
| Year | Tax Paid | Tax Assessment Tax Assessment Total Assessment is a certain percentage of the fair market value that is determined by local assessors to be the total taxable value of land and additions on the property. | Land | Improvement |
|---|---|---|---|---|
| 2024 | $3,848 | $90,760 | $21,000 | $69,760 |
| 2023 | $3,812 | $90,755 | $21,000 | $69,755 |
| 2022 | $2,803 | $55,510 | $8,120 | $47,390 |
| 2021 | $3,113 | $55,510 | $8,120 | $47,390 |
| 2020 | $2,816 | $55,510 | $8,120 | $47,390 |
| 2019 | $2,559 | $45,120 | $6,480 | $38,640 |
| 2018 | $2,699 | $45,120 | $6,480 | $38,640 |
| 2017 | $2,583 | $45,120 | $6,480 | $38,640 |
| 2016 | $2,793 | $44,590 | $9,660 | $34,930 |
| 2015 | $2,824 | $44,590 | $9,660 | $34,930 |
| 2014 | $2,855 | $44,590 | $9,660 | $34,930 |
| 2013 | $1,258 | $46,935 | $10,185 | $36,750 |
Source: Public Records
Map
Nearby Homes
- 3059 Remington Ridge Rd
- 3100 Westaire Ct
- 3811 Bay Village St
- 2825 S Hampton Rd
- 3105 Wessex Ct
- 0 Wessex Ct
- 3830 Charbonnett Ct Unit 6-A
- 3365 Bruceton Ave
- 2472 Nassau Dr Unit 37D
- 2509 Burgandy Ln Unit 46B
- 2425 Mason Village Ct Unit 2425
- 2503 Burgandy Ln Unit 46A
- 4479 Gerling Blvd
- 4485 Helen Dr
- 4486 Helen Dr
- 2275 Cardston Ct
- 2252 Meridian Ct
- 4521 Helen Dr
- 4468 Reinbeau Dr
- 4496 Reinbeau Dr
- 3667 Roxmore Ct
- 3655 Roxmore Ct
- 3660 Halloran Ct
- 3666 Halloran Ct
- 3654 Halloran Ct
- 3673 Roxmore Ct
- 3672 Halloran Ct
- 3662 Roxmore Ct
- 3668 Roxmore Ct
- 3656 Roxmore Ct
- 3678 Halloran Ct
- 3674 Roxmore Ct
- 3679 Roxmore Ct
- 3033 Briar Ridge Rd
- 3039 Briar Ridge Rd
- 3027 Briar Ridge Rd
- 3684 Halloran Ct
- 3045 Briar Ridge Rd
- 3021 Briar Ridge Rd
- 3680 Roxmore Ct