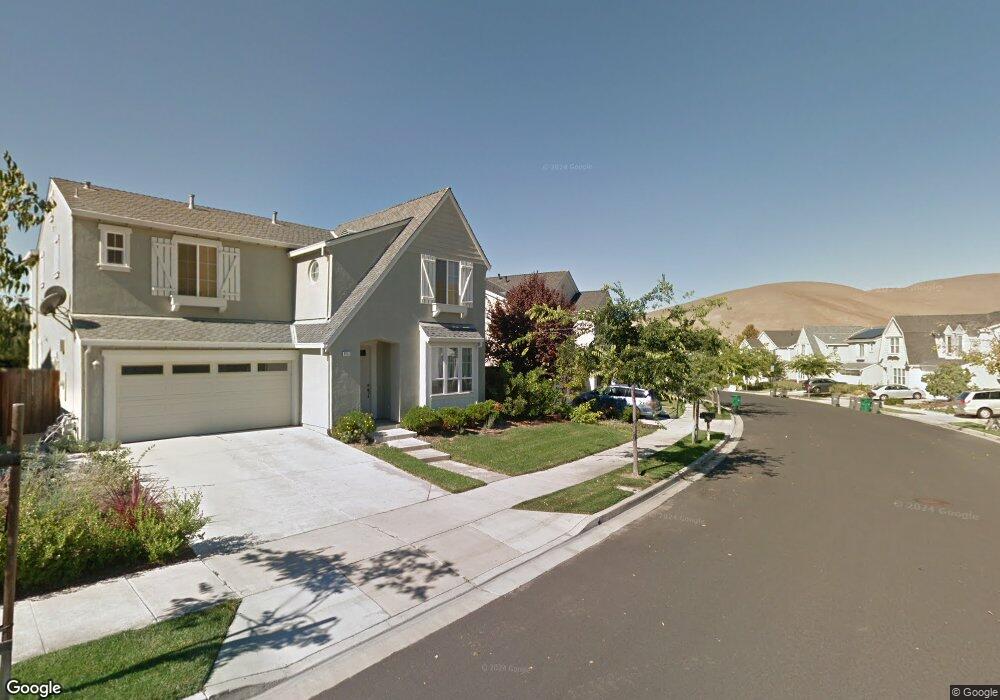
3661 Sandalford Way San Ramon, CA 94582
Gale Ranch-Windemere NeighborhoodEstimated Value: $1,885,352 - $2,076,000
5
Beds
3
Baths
2,507
Sq Ft
$793/Sq Ft
Est. Value
About This Home
This home is located at 3661 Sandalford Way, San Ramon, CA 94582 and is currently estimated at $1,987,088, approximately $792 per square foot. 3661 Sandalford Way is a home located in Contra Costa County with nearby schools including Hidden Hills Elementary School, Windemere Ranch Middle School, and Dougherty Valley High School.
Ownership History
Date
Name
Owned For
Owner Type
Purchase Details
Closed on
Jun 10, 2017
Sold by
Daggupati Naresh B and Nagineni Madhuri
Bought by
Daggupati Naresh B and Nagineni Mad Huri
Current Estimated Value
Purchase Details
Closed on
Oct 10, 2011
Sold by
The Danilo Macarandang Living Trust
Bought by
Daggupati Naresh B and Nagineni Madhuri
Home Financials for this Owner
Home Financials are based on the most recent Mortgage that was taken out on this home.
Original Mortgage
$268,000
Outstanding Balance
$182,345
Interest Rate
4.05%
Mortgage Type
New Conventional
Estimated Equity
$1,804,743
Purchase Details
Closed on
Sep 15, 2006
Sold by
Macarandang Danilo C
Bought by
The Danilo Macarandang Living Trust
Purchase Details
Closed on
Dec 28, 2004
Sold by
Greystone Homes Inc
Bought by
Macarandang Danilo C
Home Financials for this Owner
Home Financials are based on the most recent Mortgage that was taken out on this home.
Original Mortgage
$648,760
Interest Rate
1%
Mortgage Type
New Conventional
Create a Home Valuation Report for This Property
The Home Valuation Report is an in-depth analysis detailing your home's value as well as a comparison with similar homes in the area
Home Values in the Area
Average Home Value in this Area
Purchase History
| Date | Buyer | Sale Price | Title Company |
|---|---|---|---|
| Daggupati Naresh B | -- | None Available | |
| Daggupati Naresh B | $710,000 | First American Title Company | |
| The Danilo Macarandang Living Trust | -- | None Available | |
| Macarandang Danilo C | $812,500 | North American Title |
Source: Public Records
Mortgage History
| Date | Status | Borrower | Loan Amount |
|---|---|---|---|
| Open | Daggupati Naresh B | $268,000 | |
| Previous Owner | Macarandang Danilo C | $648,760 | |
| Closed | Macarandang Danilo C | $81,095 |
Source: Public Records
Tax History Compared to Growth
Tax History
| Year | Tax Paid | Tax Assessment Tax Assessment Total Assessment is a certain percentage of the fair market value that is determined by local assessors to be the total taxable value of land and additions on the property. | Land | Improvement |
|---|---|---|---|---|
| 2025 | $15,039 | $891,791 | $489,858 | $401,933 |
| 2024 | $14,847 | $874,305 | $480,253 | $394,052 |
| 2023 | $14,847 | $857,163 | $470,837 | $386,326 |
| 2022 | $14,536 | $840,356 | $461,605 | $378,751 |
| 2021 | $14,215 | $823,879 | $452,554 | $371,325 |
| 2019 | $13,893 | $799,444 | $439,132 | $360,312 |
| 2018 | $13,493 | $783,770 | $430,522 | $353,248 |
| 2017 | $13,420 | $768,403 | $422,081 | $346,322 |
| 2016 | $13,369 | $753,337 | $413,805 | $339,532 |
| 2015 | $13,198 | $742,022 | $407,590 | $334,432 |
| 2014 | $13,097 | $727,487 | $399,606 | $327,881 |
Source: Public Records
Map
Nearby Homes
- 3056 Silva Way
- 224 Riverland Ct
- 5300 Fioli Loop
- 1236 Andreas Way
- 1628 Banbury Dr
- 5132 Fioli Loop
- 6278 Murdock Way
- 1132 Hoskins Ln
- 1412 Arianna Ln
- 2073 Watermill Rd
- 2165 Watermill Rd Unit 54
- 2392 Millstream Ln
- 6130 Yardley Ln
- 6132 Alpine Blue Dr
- 1038 S Monarch Rd
- 3221 Browntail Way
- 5430 Sherwood Way
- 6260 Main Branch Rd
- 1615 Lawrence Rd
- 3422 Cinnamon Ridge Rd
- 3673 Sandalford Way
- 3651 Sandalford Way
- 3788 Vindara Ln
- 3780 Vindara Ln
- 3635 Sandalford Way
- 3685 Sandalford Way
- 3796 Vindara Ln
- 3658 Sandalford Way
- 3666 Sandalford Way
- 3772 Vindara Ln
- 3652 Sandalford Way
- 3672 Sandalford Way
- 3627 Sandalford Way
- 3678 Sandalford Way
- 3766 Vindara Ln
- 3632 Sandalford Way
- 3686 Sandalford Way
- 3070 Silva Way
- 3621 Sandalford Way
- 3079 Silva Way