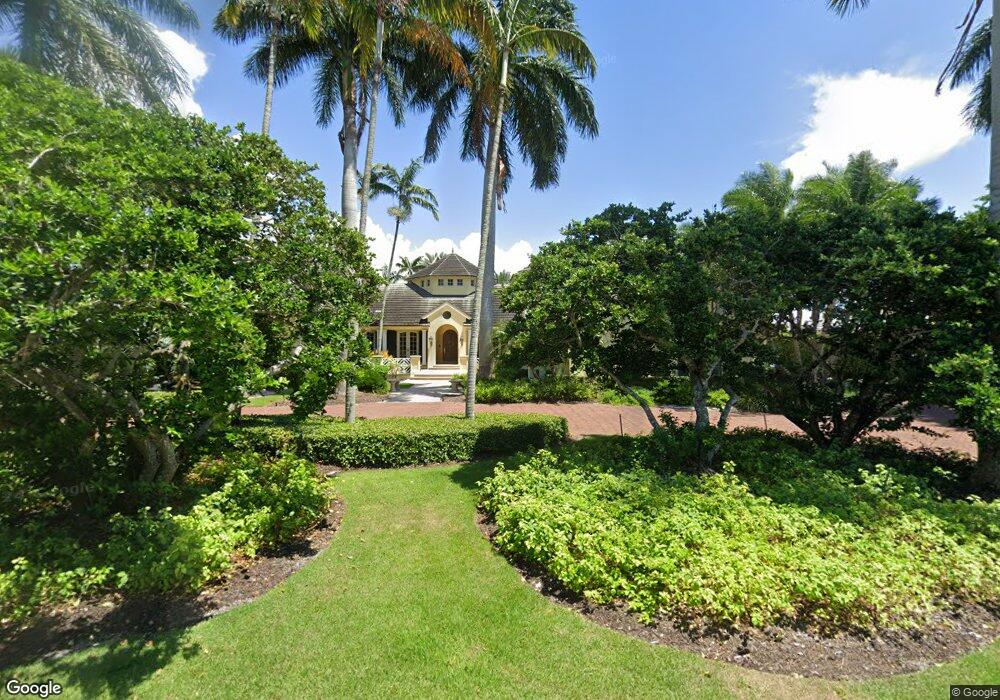
3663 Rum Row Naples, FL 34102
Port Royal NeighborhoodEstimated Value: $7,588,000 - $9,630,000
Studio
--
Bath
7,289
Sq Ft
$1,181/Sq Ft
Est. Value
About This Home
This home is located at 3663 Rum Row, Naples, FL 34102 and is currently estimated at $8,609,000, approximately $1,181 per square foot. 3663 Rum Row is a home located in Collier County with nearby schools including Lake Park Elementary School, Naples High School, and Gulfview Middle School.
Ownership History
Date
Name
Owned For
Owner Type
Purchase Details
Closed on
Oct 23, 2025
Sold by
Sharon J Von Arx Qualified Personal Resi and Gilvarg Vanessa L
Bought by
Sharon J Von Arx Trust and Gilvarg
Current Estimated Value
Purchase Details
Closed on
Oct 23, 2023
Sold by
Vonarx Sharon J
Bought by
Sharon J Von Arx Qualified Personal Residence and Gilvarg
Purchase Details
Closed on
Jun 5, 2023
Sold by
Vonarx Dolph W
Bought by
Vonarx Sharon J
Purchase Details
Closed on
Dec 30, 2020
Sold by
Arx Dolph W Von and Arx Sharon J
Bought by
Arx Sharon J Von and The Von Arx 2004 Family Trust
Purchase Details
Closed on
Feb 21, 2017
Sold by
Vonarx Dolph W and Von Arx Sharon K
Bought by
Vonarx Dolph W
Purchase Details
Closed on
Jul 24, 2000
Sold by
Midwest Homes Inc
Bought by
Vonarx Dolph W and Vonarx Sharon J
Purchase Details
Closed on
Mar 24, 2000
Sold by
Warner Beverly W and Warner Dorothy S
Bought by
Midwest Homes Inc
Home Financials for this Owner
Home Financials are based on the most recent Mortgage that was taken out on this home.
Original Mortgage
$3,200,000
Interest Rate
8.38%
Create a Home Valuation Report for This Property
The Home Valuation Report is an in-depth analysis detailing your home's value as well as a comparison with similar homes in the area
Home Values in the Area
Average Home Value in this Area
Purchase History
| Date | Buyer | Sale Price | Title Company |
|---|---|---|---|
| Sharon J Von Arx Trust | -- | None Listed On Document | |
| Sharon J Von Arx Qualified Personal Residence | -- | None Listed On Document | |
| Sharon J Von Arx Qualified Personal Residence | -- | None Listed On Document | |
| Vonarx Sharon J | -- | None Listed On Document | |
| Arx Sharon J Von | -- | Accommodation | |
| Vonarx Dolph W | -- | Attorney | |
| Vonarx Dolph W | $5,600,000 | -- | |
| Midwest Homes Inc | $4,000,000 | -- |
Source: Public Records
Mortgage History
| Date | Status | Borrower | Loan Amount |
|---|---|---|---|
| Previous Owner | Midwest Homes Inc | $3,200,000 |
Source: Public Records
Tax History
| Year | Tax Paid | Tax Assessment Tax Assessment Total Assessment is a certain percentage of the fair market value that is determined by local assessors to be the total taxable value of land and additions on the property. | Land | Improvement |
|---|---|---|---|---|
| 2025 | $80,314 | $9,105,402 | -- | -- |
| 2024 | $79,144 | $8,848,787 | -- | -- |
| 2023 | $79,144 | $8,591,055 | $0 | $0 |
| 2022 | $81,414 | $8,340,830 | $0 | $0 |
| 2021 | $82,705 | $8,097,893 | $0 | $0 |
| 2020 | $80,689 | $7,986,088 | $0 | $0 |
| 2019 | $79,734 | $7,806,538 | $0 | $0 |
| 2018 | $78,095 | $7,660,979 | $0 | $0 |
| 2017 | $76,924 | $7,503,407 | $0 | $0 |
| 2016 | $75,648 | $7,349,076 | $0 | $0 |
| 2015 | $77,231 | $7,297,990 | $0 | $0 |
| 2014 | $77,531 | $7,190,069 | $0 | $0 |
Source: Public Records
Map
Nearby Homes
- 3440 Rum Row
- 3520 Gin Ln
- 3495 Gin Ln
- 1857 Galleon Dr
- 1975 Galleon Dr
- 3430 Gin Ln
- 989 Admiralty Parade
- 3655 Fort Charles Dr
- 860 Admiralty Parade
- 1365 Spyglass Ln
- 3243 Gin Ln
- 3233 Gin Ln
- 3163 Gin Ln
- 1450 Gulfstar Dr S
- 3131 Gin Ln
- 3175 Fort Charles Dr
- 1207 Spyglass Ln
- 4115 Cutlass Ln
- 2999 Rum Row
- 12 Sabre Ln
Your Personal Tour Guide
Ask me questions while you tour the home.