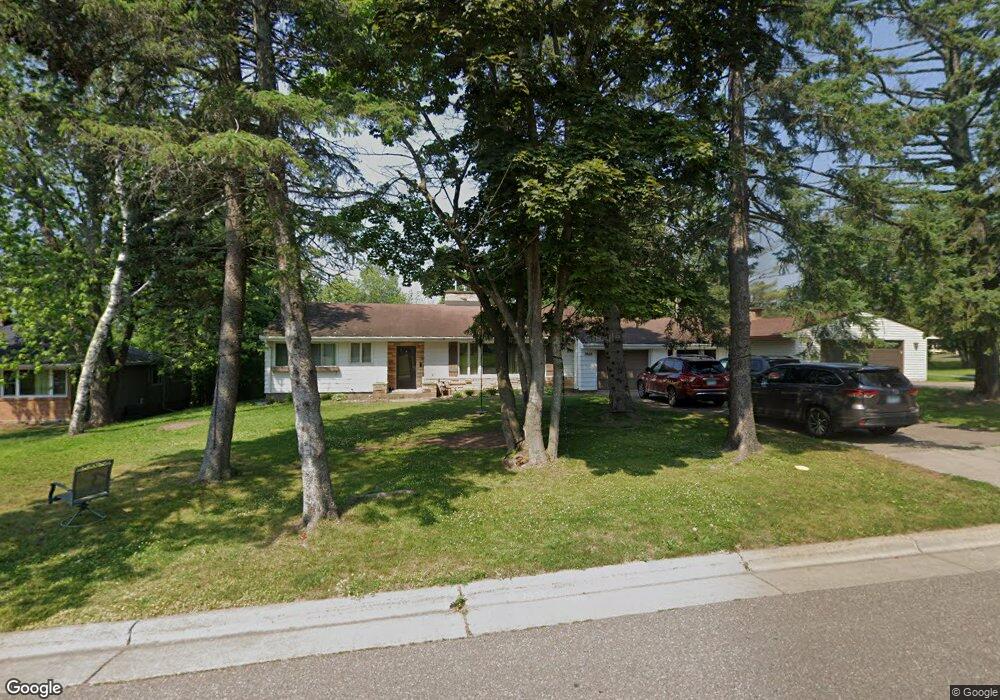
3665 E 3rd St Duluth, MN 55804
Congdon Park NeighborhoodEstimated Value: $380,386 - $466,000
3
Beds
2
Baths
1,522
Sq Ft
$284/Sq Ft
Est. Value
About This Home
This home is located at 3665 E 3rd St, Duluth, MN 55804 and is currently estimated at $431,597, approximately $283 per square foot. 3665 E 3rd St is a home located in St. Louis County with nearby schools including Congdon Elementary School, Ordean East Middle School, and East High School.
Ownership History
Date
Name
Owned For
Owner Type
Purchase Details
Closed on
Oct 2, 2015
Sold by
State Of Minnesota
Bought by
Pfahl Patrick and Mcclernon Susan E
Current Estimated Value
Home Financials for this Owner
Home Financials are based on the most recent Mortgage that was taken out on this home.
Original Mortgage
$209,000
Interest Rate
3.88%
Mortgage Type
New Conventional
Purchase Details
Closed on
Oct 1, 2015
Sold by
Mcclernon Susan E and Pfahl Patrick
Bought by
Denney James R and Denney Linda S
Home Financials for this Owner
Home Financials are based on the most recent Mortgage that was taken out on this home.
Original Mortgage
$209,000
Interest Rate
3.88%
Mortgage Type
New Conventional
Purchase Details
Closed on
Feb 19, 2015
Sold by
County Of St Louis
Bought by
Pfahl Patrick and Mcclernon Susan E
Home Financials for this Owner
Home Financials are based on the most recent Mortgage that was taken out on this home.
Original Mortgage
$115,047
Interest Rate
3.66%
Mortgage Type
Seller Take Back
Create a Home Valuation Report for This Property
The Home Valuation Report is an in-depth analysis detailing your home's value as well as a comparison with similar homes in the area
Home Values in the Area
Average Home Value in this Area
Purchase History
| Date | Buyer | Sale Price | Title Company |
|---|---|---|---|
| Pfahl Patrick | $129,500 | None Available | |
| Denney James R | $220,000 | Stewart Title Company | |
| Pfahl Patrick | $129,500 | None Available |
Source: Public Records
Mortgage History
| Date | Status | Borrower | Loan Amount |
|---|---|---|---|
| Previous Owner | Denney James R | $209,000 | |
| Previous Owner | Pfahl Patrick | $115,047 |
Source: Public Records
Tax History
| Year | Tax Paid | Tax Assessment Tax Assessment Total Assessment is a certain percentage of the fair market value that is determined by local assessors to be the total taxable value of land and additions on the property. | Land | Improvement |
|---|---|---|---|---|
| 2024 | $4,548 | $345,100 | $67,400 | $277,700 |
| 2023 | $4,548 | $298,900 | $50,300 | $248,600 |
| 2022 | $3,686 | $278,500 | $47,000 | $231,500 |
| 2021 | $3,612 | $237,200 | $40,100 | $197,100 |
| 2020 | $3,716 | $237,200 | $40,100 | $197,100 |
| 2019 | $2,920 | $237,200 | $40,100 | $197,100 |
| 2018 | $2,278 | $170,400 | $40,100 | $130,300 |
| 2017 | $2,562 | $166,900 | $40,000 | $126,900 |
| 2016 | $1,982 | $361,900 | $47,500 | $314,400 |
| 2015 | -- | $0 | $0 | $0 |
| 2014 | -- | $0 | $0 | $0 |
Source: Public Records
Map
Nearby Homes
- 110 N 36th Ave E
- 630 Valley Dr
- 3543 Greysolon Rd
- 3515 Greysolon Rd
- 3731 London Rd
- 3631 London Rd
- 3725 London Rd Unit 12
- 907 Mellwood Ave
- 124 N Hawthorne Rd
- 312 N 40th Ave E
- 4010 Robinson St
- 2931 Greysolon Rd
- 4025 Gladstone St
- 2815 E 2nd St
- 2015 Woodland Ave
- 4220 Mcculloch St
- 2201 Vermilion Rd
- 3725 N Ridge Rd
- 601 Glenwood St
- 4315 Luverne St
Your Personal Tour Guide
Ask me questions while you tour the home.