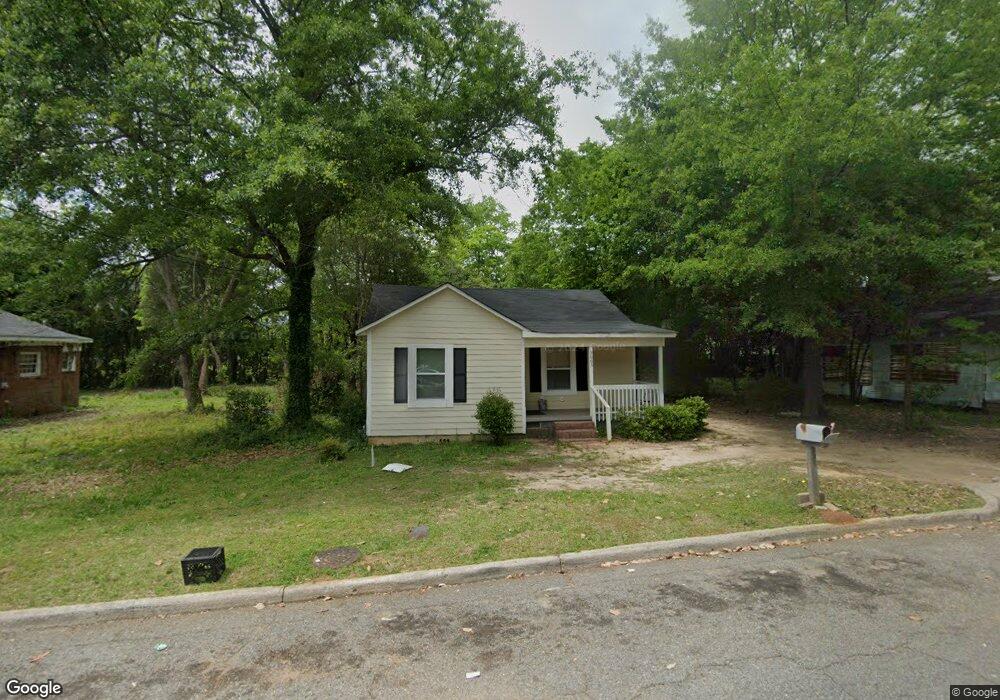
3665 San Juan Ave Macon, GA 31206
Estimated Value: $48,000 - $80,000
2
Beds
1
Bath
1,162
Sq Ft
$59/Sq Ft
Est. Value
About This Home
This home is located at 3665 San Juan Ave, Macon, GA 31206 and is currently estimated at $68,173, approximately $58 per square foot. 3665 San Juan Ave is a home located in Bibb County with nearby schools including Bruce Elementary School, Rutland Middle School, and Rutland High School.
Ownership History
Date
Name
Owned For
Owner Type
Purchase Details
Closed on
Oct 7, 2019
Sold by
Exchange Bank
Bought by
Red Fish Rentals Llc
Current Estimated Value
Purchase Details
Closed on
Apr 25, 2013
Sold by
Donald Properties Llc
Bought by
Red Fish Rentals Llc
Purchase Details
Closed on
Nov 8, 2007
Sold by
Washington Mutual Bank
Bought by
Donald Properties Llc
Home Financials for this Owner
Home Financials are based on the most recent Mortgage that was taken out on this home.
Original Mortgage
$23,520
Interest Rate
6.26%
Mortgage Type
Unknown
Purchase Details
Closed on
Jul 3, 2007
Purchase Details
Closed on
Mar 31, 2005
Sold by
Bridger William Edgar
Bought by
Mcfadden Donna
Home Financials for this Owner
Home Financials are based on the most recent Mortgage that was taken out on this home.
Original Mortgage
$24,000
Interest Rate
6.5%
Mortgage Type
Adjustable Rate Mortgage/ARM
Create a Home Valuation Report for This Property
The Home Valuation Report is an in-depth analysis detailing your home's value as well as a comparison with similar homes in the area
Home Values in the Area
Average Home Value in this Area
Purchase History
| Date | Buyer | Sale Price | Title Company |
|---|---|---|---|
| Red Fish Rentals Llc | -- | None Available | |
| Red Fish Rentals Llc | $248,200 | -- | |
| Donald Properties Llc | $17,000 | None Available | |
| -- | $2,700 | -- | |
| Washington Mutual Bank Fa | $26,684 | None Available | |
| Mcfadden Donna | $30,000 | None Available |
Source: Public Records
Mortgage History
| Date | Status | Borrower | Loan Amount |
|---|---|---|---|
| Previous Owner | Donald Properties Llc | $23,520 | |
| Previous Owner | Mcfadden Donna | $24,000 |
Source: Public Records
Tax History Compared to Growth
Tax History
| Year | Tax Paid | Tax Assessment Tax Assessment Total Assessment is a certain percentage of the fair market value that is determined by local assessors to be the total taxable value of land and additions on the property. | Land | Improvement |
|---|---|---|---|---|
| 2025 | $198 | $8,041 | $1,800 | $6,241 |
| 2024 | $196 | $7,717 | $1,800 | $5,917 |
| 2023 | $196 | $7,717 | $1,800 | $5,917 |
| 2022 | $120 | $3,452 | $1,024 | $2,428 |
| 2021 | $88 | $2,318 | $922 | $1,396 |
| 2020 | $81 | $2,094 | $922 | $1,172 |
| 2019 | $181 | $4,612 | $922 | $3,690 |
| 2018 | $413 | $3,880 | $717 | $3,163 |
| 2017 | $145 | $3,880 | $717 | $3,163 |
| 2016 | $134 | $3,880 | $717 | $3,163 |
| 2015 | $216 | $4,407 | $717 | $3,690 |
| 2014 | $402 | $7,145 | $819 | $6,326 |
Source: Public Records
Map
Nearby Homes
- 730 Villa Esta Ave
- 697 Grenada Terrace
- 826 W Grenada Terrace
- 3415 San Juan Ave
- 631 Grenada Terrace
- 3897 Tela Place
- 656 Villa Crest Ave
- 562 Villa Esta Cir
- 830 Beddingfield Ave
- 541 Lynmore Cir
- 730 Newberg Ave
- 3861 Desoto Dr
- 863 Richmond St
- 520 Villa Esta Cir
- 575 Richmond St
- 567 Richmond St
- 3861 Myrtle Ct
- 3639 San Juan Ave
- 3685 San Juan Ave
- 722 Ormond Terrace
- 710 Ormond Terrace
- 705 Villa Esta Ave
- 697 Villa Esta Ave
- 3664 San Juan Ave
- 706 Villa Esta Ave
- 696 Ormond Terrace
- 685 Villa Esta Ave
- 684 Ormond Terrace
- 673 Villa Esta Ave
- 672 Ormond Terrace
- 711 Ormond Terrace
- 712 Villa Esta Ave
- 0 Villa Esta Ave Unit 7287616
- 0 Villa Esta Ave Unit 7501099
- 0 Villa Esta Ave
- 718 Villa Esta Ave
- 698 Villa Esta Ave