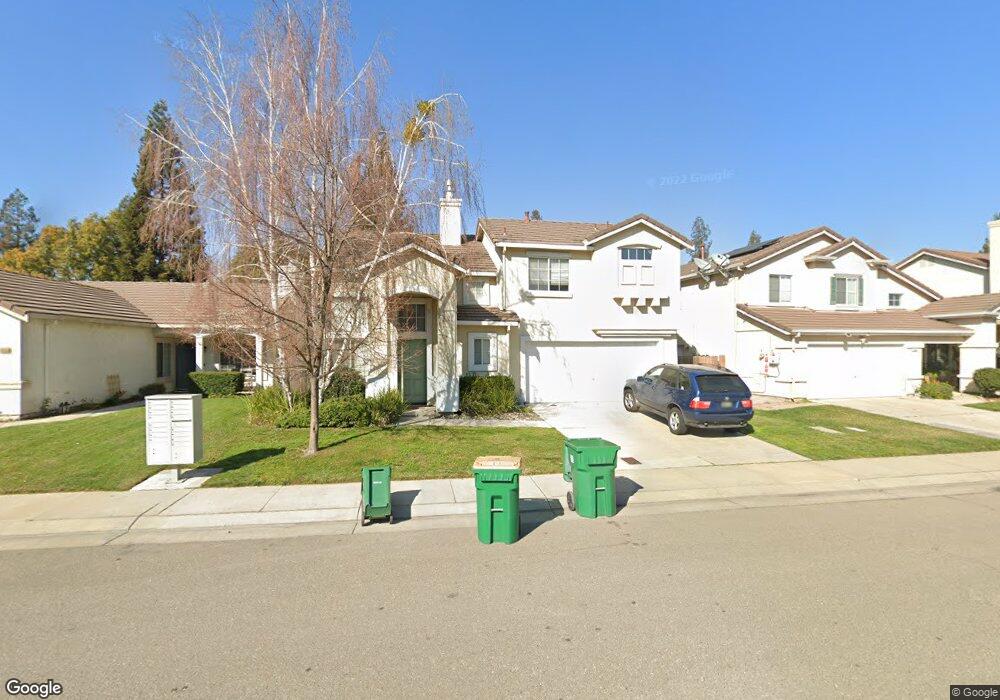
3667 Hepburn Cir Stockton, CA 95209
Spanos Park NeighborhoodEstimated Value: $299,000 - $464,000
3
Beds
3
Baths
1,300
Sq Ft
$318/Sq Ft
Est. Value
About This Home
This home is located at 3667 Hepburn Cir, Stockton, CA 95209 and is currently estimated at $413,679, approximately $318 per square foot. 3667 Hepburn Cir is a home located in San Joaquin County with nearby schools including Julia Morgan Elementary School, Christa McAuliffe Middle School, and Bear Creek High School.
Ownership History
Date
Name
Owned For
Owner Type
Purchase Details
Closed on
Sep 29, 2021
Sold by
Buck Linda A
Bought by
Buck Linda Ann and Linda Ann Buck Trust
Current Estimated Value
Purchase Details
Closed on
Nov 20, 2002
Sold by
Tzintzun Mario J and Tzintzun Tamera J
Bought by
Buck Linda A
Home Financials for this Owner
Home Financials are based on the most recent Mortgage that was taken out on this home.
Original Mortgage
$228,719
Outstanding Balance
$94,883
Interest Rate
5.89%
Mortgage Type
FHA
Estimated Equity
$318,796
Purchase Details
Closed on
Feb 9, 1999
Sold by
R E Development Corp
Bought by
Tzintzun Mario J and Tzintzun Tamera J
Home Financials for this Owner
Home Financials are based on the most recent Mortgage that was taken out on this home.
Original Mortgage
$119,178
Interest Rate
6.77%
Create a Home Valuation Report for This Property
The Home Valuation Report is an in-depth analysis detailing your home's value as well as a comparison with similar homes in the area
Home Values in the Area
Average Home Value in this Area
Purchase History
| Date | Buyer | Sale Price | Title Company |
|---|---|---|---|
| Buck Linda Ann | -- | None Available | |
| Buck Linda A | $232,000 | Alliance Title Co | |
| Tzintzun Mario J | $119,500 | Old Republic Title Company |
Source: Public Records
Mortgage History
| Date | Status | Borrower | Loan Amount |
|---|---|---|---|
| Open | Buck Linda A | $228,719 | |
| Previous Owner | Tzintzun Mario J | $119,178 | |
| Closed | Buck Linda A | $12,837 |
Source: Public Records
Tax History Compared to Growth
Tax History
| Year | Tax Paid | Tax Assessment Tax Assessment Total Assessment is a certain percentage of the fair market value that is determined by local assessors to be the total taxable value of land and additions on the property. | Land | Improvement |
|---|---|---|---|---|
| 2025 | $3,690 | $335,916 | $99,926 | $235,990 |
| 2024 | $3,621 | $329,330 | $97,967 | $231,363 |
| 2023 | $3,579 | $322,874 | $96,047 | $226,827 |
| 2022 | $3,499 | $316,544 | $94,164 | $222,380 |
| 2021 | $3,579 | $310,338 | $92,318 | $218,020 |
| 2020 | $3,492 | $307,157 | $91,372 | $215,785 |
| 2019 | $3,410 | $301,135 | $89,581 | $211,554 |
| 2018 | $3,348 | $295,231 | $87,825 | $207,406 |
| 2017 | $2,941 | $261,000 | $78,000 | $183,000 |
| 2016 | $2,583 | $239,000 | $71,000 | $168,000 |
| 2014 | $2,802 | $212,000 | $64,000 | $148,000 |
Source: Public Records
Map
Nearby Homes
- 3520 Grandi Cir
- 3510 Iron Canyon Cir
- 3010 Joshua Tree Cir
- 9853 Sleepy Hollow Ct
- 3081 Joshua Tree Cir
- 9812 Sandy Creek Way
- 3124 Estate Dr
- 3318 Estate Dr
- 2962 Smoke Tree Cir
- 9734 Fountain Valley Dr
- 2630 Eagle Rock Cir
- 9896 Thornton Rd
- 3920 Vancouver Cir
- 10849 Iris Bloom Dr
- 10601 Pleasant Valley Cir
- 2734 Fallenleaf Dr
- 2607 Summerfield Dr
- 10762 Pleasant Valley Cir
- 10628 Hidden Grove Cir
- 10816 Pleasant Valley Cir
- 3673 Hepburn Cir
- 3661 Hepburn Cir
- 3679 Hepburn Cir
- 3655 Hepburn Cir
- 3670 Hepburn Cir
- 3664 Hepburn Cir
- 3685 Hepburn Cir
- 3678 Hepburn Cir
- 3649 Hepburn Cir
- 3545 Ignacio Cir
- 3539 Ignacio Cir
- 3656 Hepburn Cir
- 3551 Ignacio Cir
- 3691 Hepburn Cir
- 3533 Ignacio Cir
- 3643 Hepburn Cir
- 3682 Hepburn Cir
- 10228 Garbo Ct
- 10223 Brando Ct
- 3527 Ignacio Cir