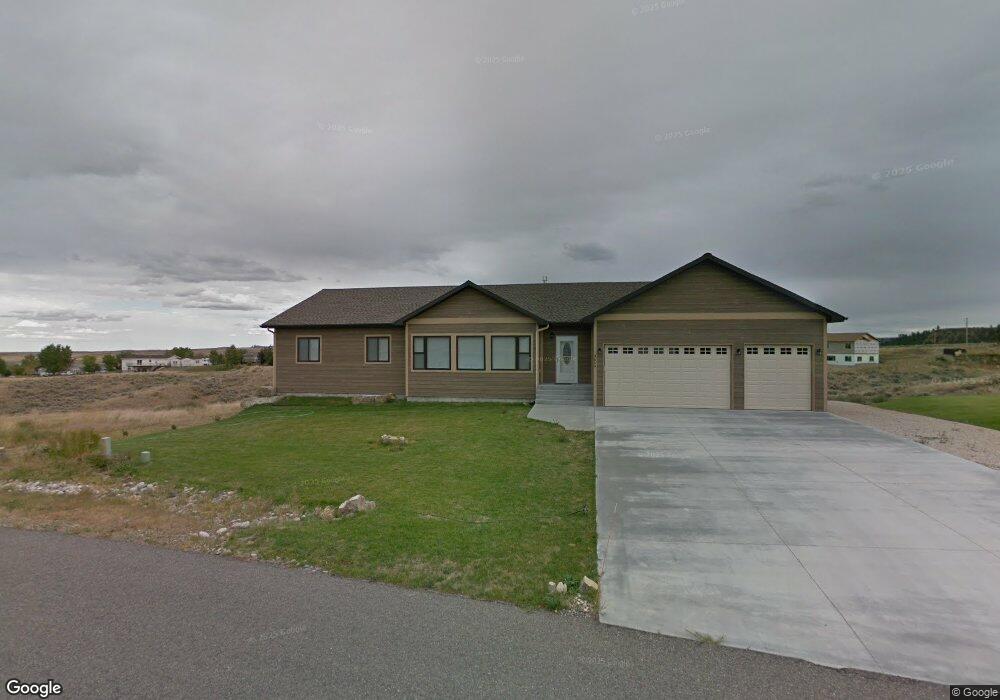
3669 Darrah Dr Huntley, MT 59037
Estimated Value: $572,123 - $665,000
3
Beds
2
Baths
3,992
Sq Ft
$156/Sq Ft
Est. Value
About This Home
This home is located at 3669 Darrah Dr, Huntley, MT 59037 and is currently estimated at $621,781, approximately $155 per square foot. 3669 Darrah Dr is a home with nearby schools including Huntley Project Elementary School, Huntley Project Junior High School, and Huntley Project High School.
Ownership History
Date
Name
Owned For
Owner Type
Purchase Details
Closed on
Sep 6, 2023
Sold by
Ruby Properties Llc
Bought by
Brillhart Waybe and Brillhart Shirlee
Current Estimated Value
Purchase Details
Closed on
Aug 30, 2023
Sold by
Brillhart Ranch Co
Bought by
Brillhart Wayne and Brillhart Shirlee
Purchase Details
Closed on
Jun 22, 2015
Sold by
Long Michael A and Long Marilyn H
Bought by
Brillhart Wayne and Brillhart Shirlee
Purchase Details
Closed on
Jun 26, 2013
Sold by
Carroll Earl
Bought by
Long Michael A and Long Marilyn H
Home Financials for this Owner
Home Financials are based on the most recent Mortgage that was taken out on this home.
Original Mortgage
$181,000
Interest Rate
3.48%
Mortgage Type
New Conventional
Purchase Details
Closed on
Jun 28, 2012
Sold by
Bell Albert G and Bell Joyce E
Bought by
Carroll Earl
Purchase Details
Closed on
May 8, 2008
Sold by
Darrah Corp Inc
Bought by
Bell Albert G and Bell Joyce E
Create a Home Valuation Report for This Property
The Home Valuation Report is an in-depth analysis detailing your home's value as well as a comparison with similar homes in the area
Home Values in the Area
Average Home Value in this Area
Purchase History
| Date | Buyer | Sale Price | Title Company |
|---|---|---|---|
| Brillhart Waybe | -- | None Listed On Document | |
| Brillhart Wayne | -- | None Listed On Document | |
| Brillhart Wayne | -- | St | |
| Long Michael A | -- | Chicago Title | |
| Carroll Earl | -- | Chicago Title | |
| Bell Albert G | -- | None Available |
Source: Public Records
Mortgage History
| Date | Status | Borrower | Loan Amount |
|---|---|---|---|
| Previous Owner | Long Michael A | $181,000 |
Source: Public Records
Tax History Compared to Growth
Tax History
| Year | Tax Paid | Tax Assessment Tax Assessment Total Assessment is a certain percentage of the fair market value that is determined by local assessors to be the total taxable value of land and additions on the property. | Land | Improvement |
|---|---|---|---|---|
| 2025 | $2,873 | $630,900 | $68,175 | $562,725 |
| 2024 | $2,873 | $492,600 | $62,064 | $430,536 |
| 2023 | $3,138 | $435,700 | $55,045 | $380,655 |
| 2022 | $2,739 | $342,300 | $0 | $0 |
| 2021 | $2,669 | $342,300 | $0 | $0 |
| 2020 | $2,639 | $333,200 | $0 | $0 |
| 2019 | $2,568 | $333,200 | $0 | $0 |
| 2018 | $2,843 | $346,800 | $0 | $0 |
| 2017 | $2,725 | $346,800 | $0 | $0 |
| 2016 | $2,297 | $322,700 | $0 | $0 |
| 2015 | $2,483 | $322,700 | $0 | $0 |
| 2014 | $2,175 | $150,202 | $0 | $0 |
Source: Public Records
Map
Nearby Homes
- 6824 Earl Ave
- 3631 Lynette Ln
- 3641 Lynette Ln
- 6815 Yellowstone Trail
- 1191 Chipper Ln
- 1246 Chipper Ln
- 1251 Chipper Ln
- 0000 Florian Ave
- 5400 Blue Horizon Dr
- 109 Peritse Ave
- 119 Peritse Ave
- 581 Squaw Creek Rd
- 0 Perth Unit 354449
- 1635 Grape St
- 4820 McGirl Rd
- 5840,5850,5904 Lunder Ln
- 4627 Brookhaven Place
- 5040 Old Hardin Rd
- 5510 Powmer Rd
- 4511 Pine Hills Rd
- 3655 Darrah Dr
- 3685 Darrah Dr
- 3664 Darrah Dr
- 3664 Darrah Dr
- 3678 Darrah Dr
- 3641 Darrah Dr
- 3699 Darrah Dr
- 7 Darrah Dr
- 3675 Gabriel Dr
- 3692 Darrah Dr
- 3663 Gabriel Dr
- 3636 Darrah Dr
- 3691 Gabriel Dr
- 3691 Gabriel Dr
- 6707 Earl Ave
- LOT 8 Gabriel Dr
- 3672 Gabriel Dr
- 3701 Darrah Dr
- 3649 Gabriel Dr
- 3660 Gabriel Dr