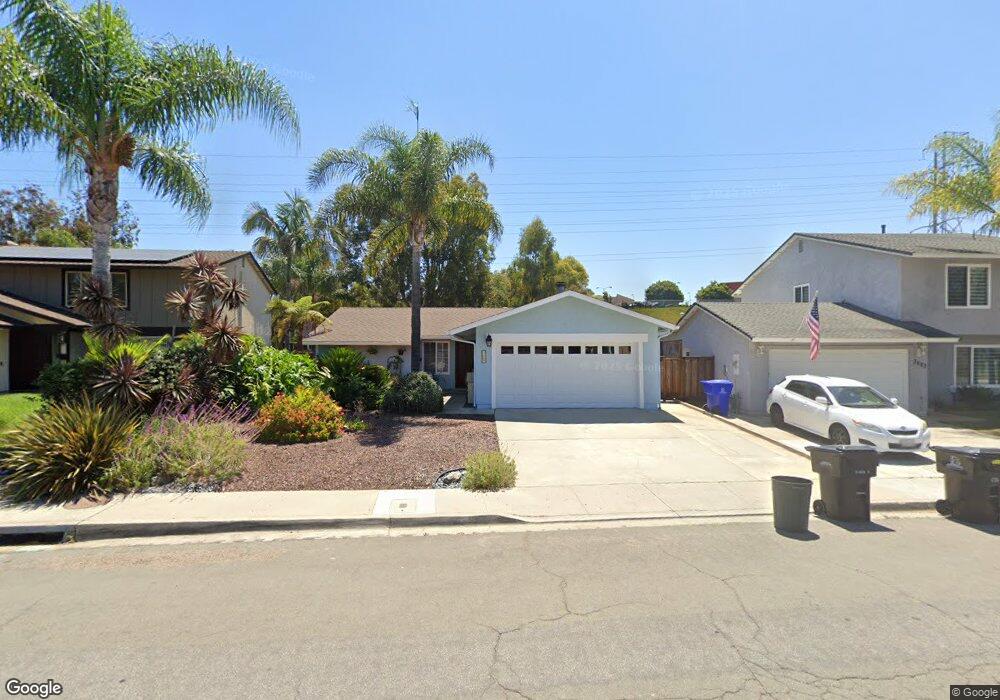
3669 Mount Ariane Dr San Diego, CA 92111
Clairemont Mesa West NeighborhoodEstimated Value: $1,110,677 - $1,343,000
3
Beds
2
Baths
1,370
Sq Ft
$904/Sq Ft
Est. Value
About This Home
This home is located at 3669 Mount Ariane Dr, San Diego, CA 92111 and is currently estimated at $1,237,919, approximately $903 per square foot. 3669 Mount Ariane Dr is a home located in San Diego County with nearby schools including Holmes Elementary, Marston Middle School, and Clairemont High School.
Ownership History
Date
Name
Owned For
Owner Type
Purchase Details
Closed on
Feb 9, 2021
Sold by
Anderson James H and Anderson June P
Bought by
Anderson Christine M and Anderson Karen K
Current Estimated Value
Purchase Details
Closed on
Aug 1, 2019
Sold by
Driver Gayle Braun and Driver Ben
Bought by
Driver Gayle Braun
Purchase Details
Closed on
Jul 10, 2019
Sold by
Drive Gayle Braun
Bought by
Anderson James H and Anderson June P
Purchase Details
Closed on
Jun 27, 2019
Sold by
Yeakle Gayle Braun
Bought by
Driyer Gayle Braun
Purchase Details
Closed on
Oct 16, 2015
Sold by
Yeakle Michael D and Yeakle Gayle G
Bought by
Yeakle Gayle B
Home Financials for this Owner
Home Financials are based on the most recent Mortgage that was taken out on this home.
Original Mortgage
$254,600
Interest Rate
3.87%
Mortgage Type
New Conventional
Purchase Details
Closed on
Nov 16, 2013
Sold by
Yeakle Michael D and Yeakle Gayle B
Bought by
Yeakle Gayle B
Create a Home Valuation Report for This Property
The Home Valuation Report is an in-depth analysis detailing your home's value as well as a comparison with similar homes in the area
Home Values in the Area
Average Home Value in this Area
Purchase History
| Date | Buyer | Sale Price | Title Company |
|---|---|---|---|
| Anderson Christine M | -- | None Available | |
| Driver Gayle Braun | -- | Chicago Title Company | |
| Anderson James H | $738,000 | Chicago Title Company | |
| Driyer Gayle Braun | -- | None Available | |
| Yeakle Gayle B | -- | Lawyers Title | |
| Yeakle Gayle B | -- | None Available |
Source: Public Records
Mortgage History
| Date | Status | Borrower | Loan Amount |
|---|---|---|---|
| Previous Owner | Yeakle Gayle B | $254,600 |
Source: Public Records
Tax History Compared to Growth
Tax History
| Year | Tax Paid | Tax Assessment Tax Assessment Total Assessment is a certain percentage of the fair market value that is determined by local assessors to be the total taxable value of land and additions on the property. | Land | Improvement |
|---|---|---|---|---|
| 2025 | $7,236 | $598,088 | $298,445 | $299,643 |
| 2024 | $7,236 | $586,362 | $292,594 | $293,768 |
| 2023 | $7,076 | $574,865 | $286,857 | $288,008 |
| 2022 | $6,888 | $563,594 | $281,233 | $282,361 |
| 2021 | $6,755 | $552,544 | $275,719 | $276,825 |
| 2020 | $6,672 | $546,879 | $272,892 | $273,987 |
| 2019 | $2,753 | $227,779 | $113,647 | $114,132 |
| 2018 | $2,655 | $223,314 | $111,419 | $111,895 |
| 2017 | $2,592 | $218,936 | $109,235 | $109,701 |
| 2016 | $2,468 | $214,644 | $107,094 | $107,550 |
| 2015 | $2,447 | $211,421 | $105,486 | $105,935 |
| 2014 | $2,474 | $207,280 | $103,420 | $103,860 |
Source: Public Records
Map
Nearby Homes
- 3567 Mount Everest Blvd
- 3526 Mount Abbey Ave
- 3581 Mount Abbey Ave
- 3635 Mount Abbey Ave
- 3855 Mount Blackburn Ave
- 3516 Old Cobble Rd
- 4870 Mount Armour Dr
- 3432 Mount Ariane Dr
- 3942 Mount Acadia Blvd
- 3710 Old Cobble Rd
- 3270 W Fox Run Way Unit 2
- 5252 Mount Blanca Dr
- 3298 Old Heather Rd
- 3218 Old Bridgeport Way
- 3226 Old Heather Rd
- 3173 Via Arcilla
- 3405 Aveley Place
- 3161 Mount Tami Dr
- 5273 Mount Alifan Dr
- 5289 Mount Alifan Dr
- 3675 Mount Ariane Dr
- 3663 Mount Ariane Dr
- 3679 Mount Ariane Dr
- 3657 Mount Ariane Dr
- 3683 Mount Ariane Dr
- 3651 Mount Ariane Dr
- 3660 Mount Ariane Dr
- 3648 Mount Ariane Dr
- 3666 Mount Ariane Dr
- 3687 Mount Ariane Dr
- 3645 Mount Ariane Dr
- 3672 Mount Ariane Dr
- 3642 Mount Ariane Dr
- 3691 Mount Ariane Dr
- 3678 Mount Ariane Dr
- 3636 Mount Ariane Dr
- 3655 Cameo Ln
- 3639 Mount Ariane Dr
- 3657 Mount Everest Blvd
- 3669 Mount Everest Blvd