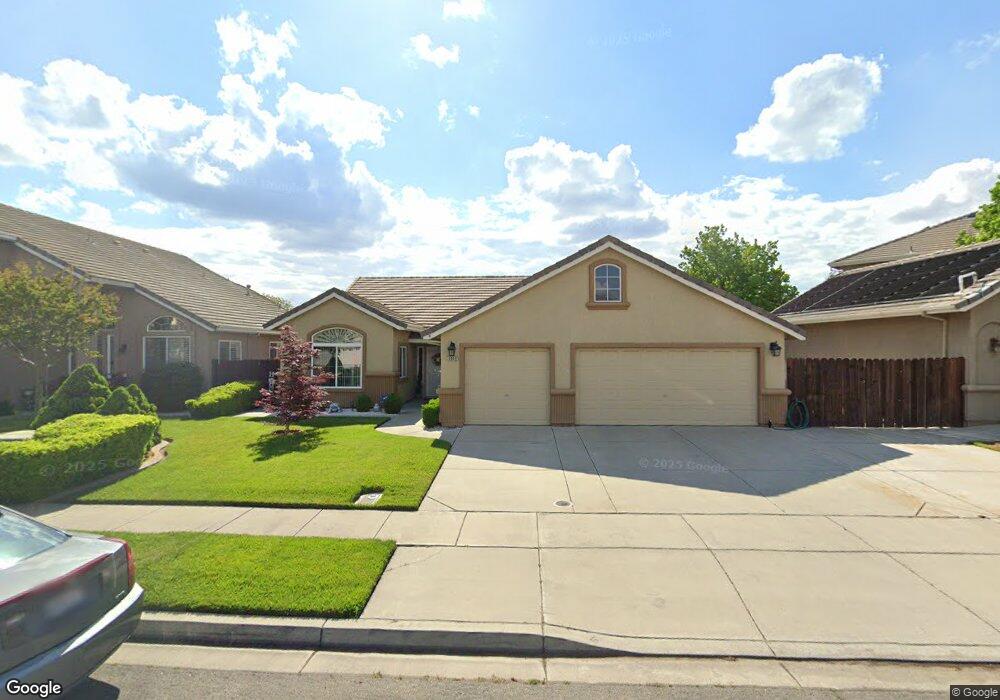
3669 N Kilroy Rd Turlock, CA 95382
Estimated Value: $393,000 - $562,000
4
Beds
2
Baths
1,700
Sq Ft
$290/Sq Ft
Est. Value
About This Home
This home is located at 3669 N Kilroy Rd, Turlock, CA 95382 and is currently estimated at $493,574, approximately $290 per square foot. 3669 N Kilroy Rd is a home located in Stanislaus County with nearby schools including Sandra Tovar Medeiros Elementary School, Turlock Junior High School, and Marvin A. Dutcher Middle School.
Ownership History
Date
Name
Owned For
Owner Type
Purchase Details
Closed on
Aug 25, 2025
Sold by
2022 Francis L Knapp and 2022 Norma J
Bought by
Leon Christa Jean and Leon Daniel Albert
Current Estimated Value
Home Financials for this Owner
Home Financials are based on the most recent Mortgage that was taken out on this home.
Original Mortgage
$465,600
Outstanding Balance
$465,600
Interest Rate
6.75%
Mortgage Type
New Conventional
Estimated Equity
$27,974
Purchase Details
Closed on
May 12, 2022
Sold by
Knapp Francis Leroy and Knapp Norma Jean
Bought by
2022 Francis Knapp And Norma J Knapp Revocabl and Knapp
Purchase Details
Closed on
Oct 4, 2002
Sold by
Franco Raymond N and Franco Pamela G
Bought by
Knapp Francis Leroy and Knapp Norma Jean
Home Financials for this Owner
Home Financials are based on the most recent Mortgage that was taken out on this home.
Original Mortgage
$135,000
Interest Rate
6.22%
Create a Home Valuation Report for This Property
The Home Valuation Report is an in-depth analysis detailing your home's value as well as a comparison with similar homes in the area
Home Values in the Area
Average Home Value in this Area
Purchase History
| Date | Buyer | Sale Price | Title Company |
|---|---|---|---|
| Leon Christa Jean | $480,000 | Stewart Title Of California | |
| 2022 Francis Knapp And Norma J Knapp Revocabl | -- | None Listed On Document | |
| Knapp Francis Leroy | $216,500 | Chicago Title |
Source: Public Records
Mortgage History
| Date | Status | Borrower | Loan Amount |
|---|---|---|---|
| Open | Leon Christa Jean | $465,600 | |
| Previous Owner | Knapp Francis Leroy | $135,000 |
Source: Public Records
Tax History Compared to Growth
Tax History
| Year | Tax Paid | Tax Assessment Tax Assessment Total Assessment is a certain percentage of the fair market value that is determined by local assessors to be the total taxable value of land and additions on the property. | Land | Improvement |
|---|---|---|---|---|
| 2025 | $1,678 | $159,641 | $33,951 | $125,690 |
| 2024 | $1,716 | $156,512 | $33,286 | $123,226 |
| 2023 | $1,870 | $153,444 | $32,634 | $120,810 |
| 2022 | $1,844 | $150,437 | $31,995 | $118,442 |
| 2021 | $1,785 | $147,488 | $31,368 | $116,120 |
| 2020 | $1,768 | $145,977 | $31,047 | $114,930 |
| 2019 | $1,727 | $143,116 | $30,439 | $112,677 |
| 2018 | $1,724 | $140,311 | $29,843 | $110,468 |
| 2017 | $1,665 | $137,560 | $29,258 | $108,302 |
| 2016 | $1,565 | $134,864 | $28,685 | $106,179 |
| 2015 | $1,546 | $132,840 | $28,255 | $104,585 |
| 2014 | $1,526 | $130,239 | $27,702 | $102,537 |
Source: Public Records
Map
Nearby Homes
- 3293 Dewar Ln
- 3403 Spring Crest Dr
- 2430 Trellis Ln
- 3367 Four Seasons Dr
- 4205 Moon Rose Ct
- 2123 Spring Blossom Ln
- 3300 Spring Garden Dr
- 1883 Ethan Allen Ct
- 4320 Panorama Ave
- 4325 Alba Ct
- 4305 Pastoral Ave
- 3884 Paula Ct
- 3723 Honeycreeper Dr
- 1983 Greenfield Dr
- 1360 Shady Ln Unit 1022
- 1360 Shady Ln Unit 522
- 1360 Shady Ln Unit 923
- 99 Golden State Hwy
- 2821 Messenger Ct
- 2620 Bird Rock Place
- 3659 N Kilroy Rd
- 3662 Heirloom Ct
- 3652 Heirloom Ct
- 3649 N Kilroy Rd
- 3642 Heirloom Ct
- 3720 N Kilroy Rd
- 3639 N Kilroy Rd
- 3700 N Kilroy Rd
- 3632 Heirloom Ct
- 3740 N Kilroy Rd
- 3680 N Kilroy Rd
- 3699 N Kilroy Rd
- 3760 N Kilroy Rd
- 3672 Heirloom Ct
- 3629 N Kilroy Rd
- 3622 Heirloom Ct
- 3660 N Kilroy Rd
- 3780 N Kilroy Rd
- 3731 Summerdale Ave
- 3651 Heirloom Ct