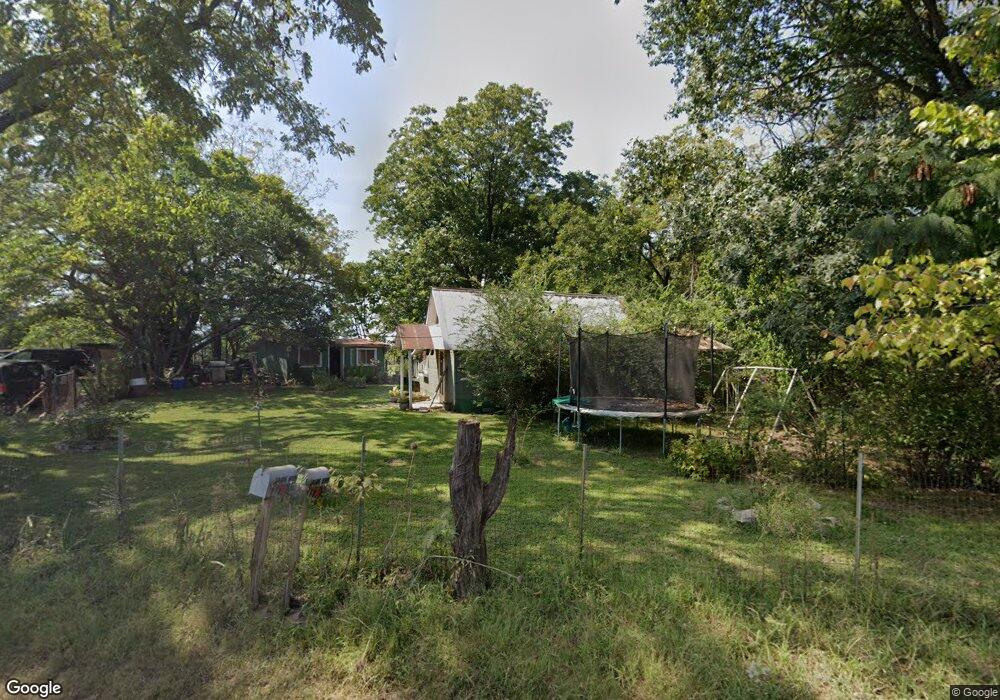
3669 N Woolum Rd Saint Joe, AR 72675
Estimated Value: $242,000 - $580,582
--
Bed
1
Bath
1,767
Sq Ft
$233/Sq Ft
Est. Value
About This Home
This home is located at 3669 N Woolum Rd, Saint Joe, AR 72675 and is currently estimated at $411,291, approximately $232 per square foot. 3669 N Woolum Rd is a home located in Marion County with nearby schools including St. Joe K-12 School, St. Joe Elementary School, and St. Joe High School.
Ownership History
Date
Name
Owned For
Owner Type
Purchase Details
Closed on
Jun 18, 2008
Sold by
Wade Chris V and Wade Diane
Bought by
Brown Ernest
Current Estimated Value
Purchase Details
Closed on
May 5, 2008
Sold by
Plumlee Darrell Gene and Plumlee Deborah Jane
Bought by
Brown Ernest
Purchase Details
Closed on
Apr 25, 2008
Sold by
Richiert James and Richiert Pamela
Bought by
Brown Ernest
Purchase Details
Closed on
Jan 12, 2006
Sold by
Freeman Clenton L and Freeman Norma
Bought by
Brown Ernest
Purchase Details
Closed on
Sep 12, 2005
Sold by
Wade Christopher V and Wade Rosalee D
Bought by
Brown Ernest
Purchase Details
Closed on
Jul 29, 2005
Sold by
Alston Michael W and Alston Brigitte B
Bought by
Brown Ernest
Purchase Details
Closed on
May 19, 2005
Sold by
Mcgowne James
Bought by
Brown Ernest
Purchase Details
Closed on
Feb 22, 2005
Sold by
Schad Bart
Bought by
Brown Ernest
Purchase Details
Closed on
Jul 11, 2003
Sold by
Brown Melina
Bought by
Brown Ernest
Purchase Details
Closed on
Mar 11, 1998
Bought by
Plumlee
Purchase Details
Closed on
Sep 28, 1988
Bought by
Wd
Purchase Details
Closed on
Aug 24, 1988
Bought by
Qcd
Create a Home Valuation Report for This Property
The Home Valuation Report is an in-depth analysis detailing your home's value as well as a comparison with similar homes in the area
Home Values in the Area
Average Home Value in this Area
Purchase History
| Date | Buyer | Sale Price | Title Company |
|---|---|---|---|
| Brown Ernest | -- | -- | |
| Brown Ernest | -- | -- | |
| Brown Ernest | -- | -- | |
| Brown Ernest | -- | -- | |
| Brown Ernest | -- | -- | |
| Brown Ernest | -- | -- | |
| Brown Ernest | -- | -- | |
| Brown Ernest | -- | -- | |
| Brown Ernest | -- | -- | |
| Brown Ernest | -- | -- | |
| Plumlee | $100,000 | -- | |
| Wd | $5,000 | -- | |
| Qcd | -- | -- |
Source: Public Records
Tax History Compared to Growth
Tax History
| Year | Tax Paid | Tax Assessment Tax Assessment Total Assessment is a certain percentage of the fair market value that is determined by local assessors to be the total taxable value of land and additions on the property. | Land | Improvement |
|---|---|---|---|---|
| 2024 | $1,369 | $63,170 | $6,270 | $56,900 |
| 2023 | $927 | $58,800 | $6,220 | $52,580 |
| 2022 | $977 | $58,800 | $6,220 | $52,580 |
| 2021 | $953 | $58,800 | $6,220 | $52,580 |
| 2020 | $942 | $51,070 | $2,250 | $48,820 |
| 2019 | $960 | $51,070 | $2,250 | $48,820 |
| 2018 | $985 | $51,070 | $2,250 | $48,820 |
| 2017 | $985 | $51,070 | $2,250 | $48,820 |
| 2016 | $967 | $28,670 | $2,250 | $26,420 |
| 2015 | $967 | $28,670 | $1,180 | $27,490 |
| 2014 | -- | $28,670 | $1,180 | $27,490 |
| 2013 | -- | $28,670 | $1,180 | $27,490 |
| 2012 | -- | $28,670 | $1,180 | $27,490 |
Source: Public Records
Map
Nearby Homes
- 400 Fowler Spring Rd
- 19922 U S 65
- 214 Eclipse Rd
- 454 Cattail Rd
- 396 Dawn Light Dr
- 358 Dawn Light Dr
- 0 Exchange Dr
- 660 Labrador Ln
- 610 S Woolum Rd
- 0 Eclipse Rd
- 1 Eclipse Rd
- 0 Mt Hersey Rd Unit 148151
- 18942 N Hwy 65
- 18659 & 18607 N Us-65
- 398 Donkey Trail
- 0 Nc 4055 Rd Unit 25034147
- 0 Nc 4055 Rd Unit 1319240
- 167 US 65b
- 1021 Margaret White Bluff Rd
- 325 U S 65