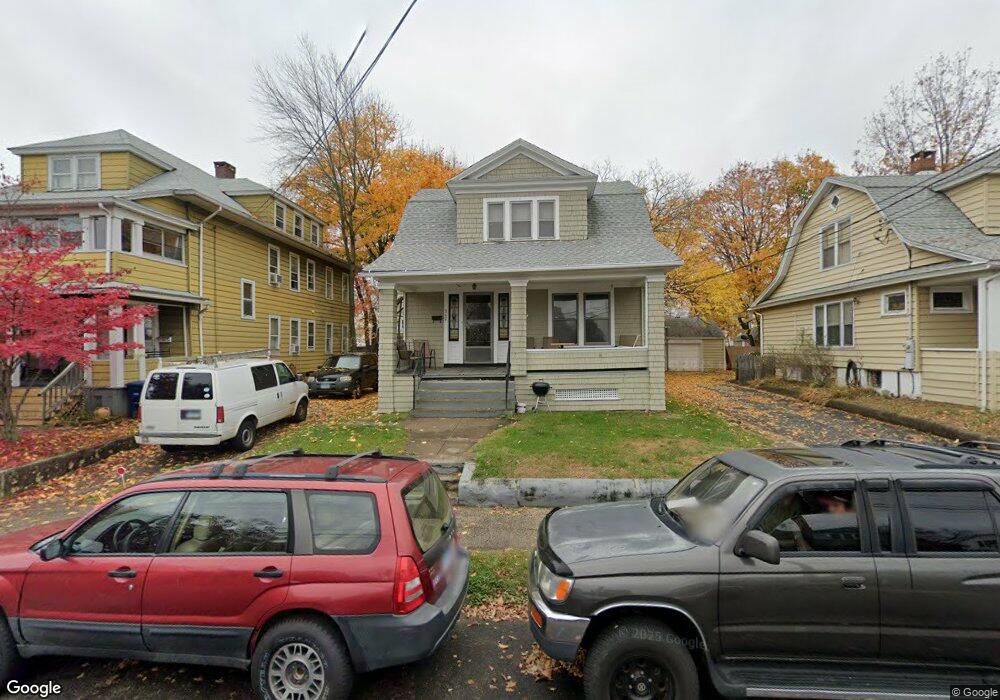
367 Anson St Bridgeport, CT 06606
Brooklawn-Saint Vincent NeighborhoodEstimated Value: $358,000 - $466,000
3
Beds
2
Baths
1,205
Sq Ft
$325/Sq Ft
Est. Value
About This Home
This home is located at 367 Anson St, Bridgeport, CT 06606 and is currently estimated at $391,448, approximately $324 per square foot. 367 Anson St is a home located in Fairfield County with nearby schools including Read School, Central High School, and Catholic Academy of Bridgeport-St. Raphael Academy.
Ownership History
Date
Name
Owned For
Owner Type
Purchase Details
Closed on
Oct 12, 2017
Sold by
Williams Dennis
Bought by
Mastronardi Paul
Current Estimated Value
Home Financials for this Owner
Home Financials are based on the most recent Mortgage that was taken out on this home.
Original Mortgage
$51,410
Outstanding Balance
$42,942
Interest Rate
3.82%
Mortgage Type
Unknown
Estimated Equity
$348,506
Create a Home Valuation Report for This Property
The Home Valuation Report is an in-depth analysis detailing your home's value as well as a comparison with similar homes in the area
Home Values in the Area
Average Home Value in this Area
Purchase History
| Date | Buyer | Sale Price | Title Company |
|---|---|---|---|
| Mastronardi Paul | $53,000 | -- | |
| Mastronardi Paul | $53,000 | -- |
Source: Public Records
Mortgage History
| Date | Status | Borrower | Loan Amount |
|---|---|---|---|
| Open | Mastronardi Paul | $51,410 | |
| Closed | Mastronardi Paul | $51,410 |
Source: Public Records
Tax History
| Year | Tax Paid | Tax Assessment Tax Assessment Total Assessment is a certain percentage of the fair market value that is determined by local assessors to be the total taxable value of land and additions on the property. | Land | Improvement |
|---|---|---|---|---|
| 2025 | $5,904 | $135,880 | $67,720 | $68,160 |
| 2024 | $5,904 | $135,880 | $67,720 | $68,160 |
| 2023 | $5,904 | $135,880 | $67,720 | $68,160 |
| 2022 | $5,904 | $135,880 | $67,720 | $68,160 |
| 2021 | $5,904 | $135,880 | $67,720 | $68,160 |
| 2020 | $5,292 | $98,020 | $41,030 | $56,990 |
| 2019 | $5,292 | $98,020 | $41,030 | $56,990 |
| 2018 | $5,329 | $98,020 | $41,030 | $56,990 |
| 2017 | $5,329 | $98,020 | $41,030 | $56,990 |
| 2016 | $5,329 | $98,020 | $41,030 | $56,990 |
| 2015 | $4,913 | $116,430 | $41,380 | $75,050 |
| 2014 | $4,913 | $116,430 | $41,380 | $75,050 |
Source: Public Records
Map
Nearby Homes
- 208 Fairview Ave Unit 210
- 457 Summit St
- 25 Westfield Ave
- 329 Ezra St
- 936 Lindley St
- 95 Savoy St
- 1265 Lindley St
- 926 Hart St
- 916 Hart St
- 74 Harlem Ave
- 123 Harlem Ave
- 45 Stevens St Unit 3L
- 254 Wayne St
- 51 Marion St Unit 55
- 234 Savoy St
- 248 Salem St
- 138 Infield St
- 631 Fairview Ave
- 92 Lincoln Ave
- 26 Marsdale Ave
Your Personal Tour Guide
Ask me questions while you tour the home.