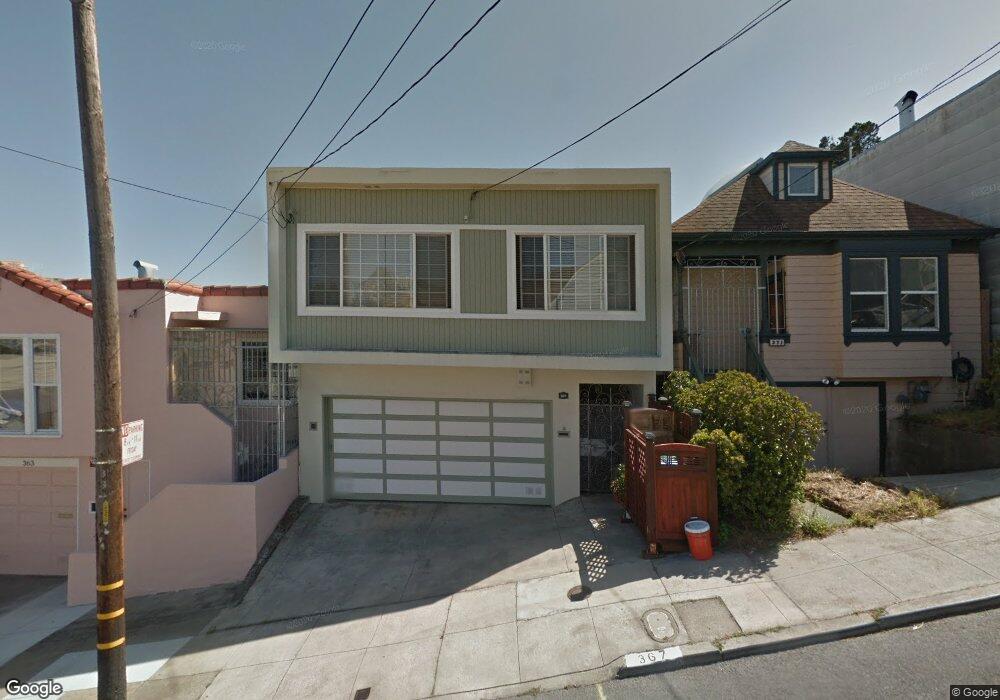
367 Arleta Ave San Francisco, CA 94134
Visitacion Valley NeighborhoodEstimated Value: $940,462 - $1,099,000
3
Beds
2
Baths
1,475
Sq Ft
$685/Sq Ft
Est. Value
About This Home
This home is located at 367 Arleta Ave, San Francisco, CA 94134 and is currently estimated at $1,010,116, approximately $684 per square foot. 367 Arleta Ave is a home located in San Francisco County with nearby schools including El Dorado Elementary School, Visitacion Valley Middle School, and KIPP Bayview Academy.
Ownership History
Date
Name
Owned For
Owner Type
Purchase Details
Closed on
Sep 13, 2023
Sold by
Cai Guang Jun
Bought by
Cai/Zhang Family Trust and Cai
Current Estimated Value
Purchase Details
Closed on
Aug 19, 1999
Sold by
Jun Cai Guang and Zhang Sophia X Q
Bought by
Cai Guang Jun and Zhang Sophia X Q
Home Financials for this Owner
Home Financials are based on the most recent Mortgage that was taken out on this home.
Original Mortgage
$162,000
Interest Rate
7.56%
Purchase Details
Closed on
Jul 1, 1996
Sold by
Wei Zhang Guo and Lan Ying
Bought by
Cai Guang Jun and Zhang Sophia X O
Purchase Details
Closed on
Mar 30, 1994
Sold by
Zhang Guo Wei and Zhang Ying Lan
Bought by
Zhang Guo Wei and Zhang Ying Lan
Home Financials for this Owner
Home Financials are based on the most recent Mortgage that was taken out on this home.
Original Mortgage
$203,150
Interest Rate
6.86%
Create a Home Valuation Report for This Property
The Home Valuation Report is an in-depth analysis detailing your home's value as well as a comparison with similar homes in the area
Home Values in the Area
Average Home Value in this Area
Purchase History
| Date | Buyer | Sale Price | Title Company |
|---|---|---|---|
| Cai/Zhang Family Trust | -- | None Listed On Document | |
| Cai Guang Jun | -- | Fidelity National Title Co | |
| Cai Guang Jun | -- | -- | |
| Zhang Guo Wei | -- | Old Republic Title Company |
Source: Public Records
Mortgage History
| Date | Status | Borrower | Loan Amount |
|---|---|---|---|
| Previous Owner | Cai Guang Jun | $162,000 | |
| Previous Owner | Zhang Guo Wei | $203,150 |
Source: Public Records
Tax History Compared to Growth
Tax History
| Year | Tax Paid | Tax Assessment Tax Assessment Total Assessment is a certain percentage of the fair market value that is determined by local assessors to be the total taxable value of land and additions on the property. | Land | Improvement |
|---|---|---|---|---|
| 2025 | $5,179 | $448,434 | $208,947 | $239,487 |
| 2024 | $5,179 | $439,642 | $204,850 | $234,792 |
| 2023 | $5,104 | $430,988 | $200,816 | $230,172 |
| 2022 | $5,635 | $422,540 | $196,880 | $225,660 |
| 2021 | $5,529 | $414,256 | $193,020 | $221,236 |
| 2020 | $5,570 | $410,010 | $191,042 | $218,968 |
| 2019 | $5,382 | $401,974 | $187,298 | $214,676 |
| 2018 | $5,200 | $394,094 | $183,626 | $210,468 |
| 2017 | $4,839 | $386,368 | $180,026 | $206,342 |
| 2016 | $4,736 | $378,796 | $176,498 | $202,298 |
| 2015 | $4,675 | $373,108 | $173,848 | $199,260 |
| 2014 | $4,552 | $365,802 | $170,444 | $195,358 |
Source: Public Records
Map
Nearby Homes
- 291 Raymond Ave
- 550 Leland Ave
- 137 Arleta Ave
- 451 Sawyer St
- 771 Delta St
- 73 Tioga Ave
- 1316 Bowdoin St
- 420 Harkness Ave
- 750 Mansell St
- 1162 Bowdoin St
- 1081 Goettingen St
- 248 Ordway St
- 3630 San Bruno Ave
- 0 Accacia St
- 819 Brussels St
- 68 Esquina Dr
- 38 Jennings Ct Unit 38
- 107 Dwight St
- 1383 Bacon St
- 311 Ottilia St
- 363 Arleta Ave
- 371 Arleta Ave
- 359 Arleta Ave
- 375 Arleta Ave
- 355 Arleta Ave
- 379 Arleta Ave
- 351 Arleta Ave
- 383 Arleta Ave
- 366 Raymond Ave
- 362 Raymond Ave
- 370 Raymond Ave
- 358 Raymond Ave
- 374 Raymond Ave
- 347 Arleta Ave
- 354 Raymond Ave
- 378 Raymond Ave
- 387 Arleta Ave
- 350 Raymond Ave
- 384 Raymond Ave
- 378 Arleta Ave