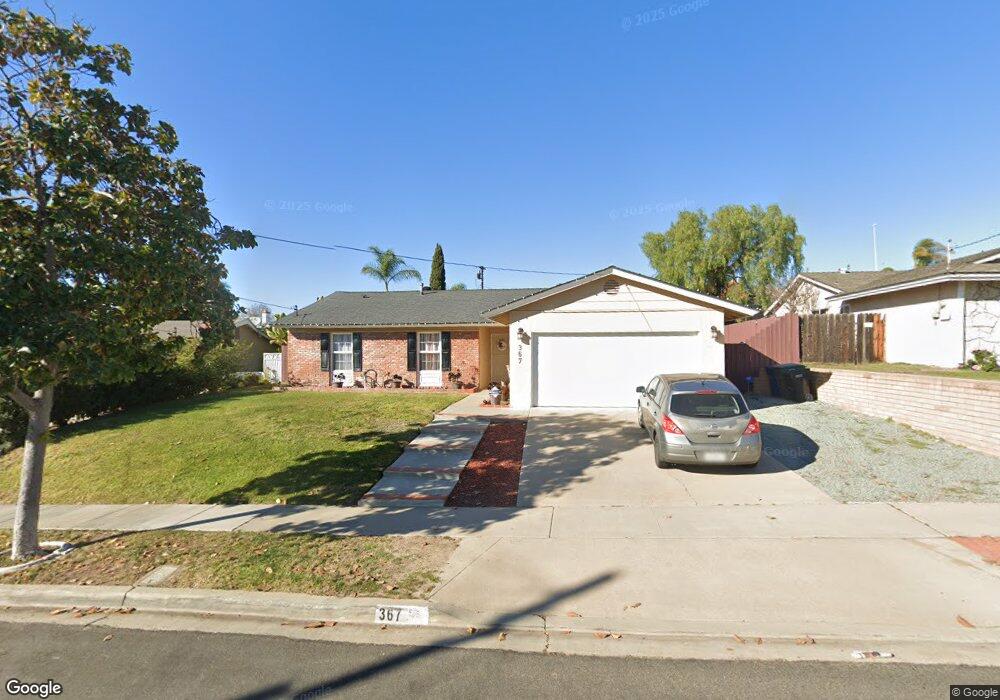
367 E Moss St Chula Vista, CA 91911
Castle Park NeighborhoodEstimated Value: $743,000 - $876,000
3
Beds
2
Baths
1,352
Sq Ft
$598/Sq Ft
Est. Value
About This Home
This home is located at 367 E Moss St, Chula Vista, CA 91911 and is currently estimated at $808,905, approximately $598 per square foot. 367 E Moss St is a home located in San Diego County with nearby schools including Karl H Kellogg Elementary School, Hilltop Middle School, and Hilltop Senior High School.
Ownership History
Date
Name
Owned For
Owner Type
Purchase Details
Closed on
Aug 1, 2016
Sold by
Rocha Enrique and Tellez Dian
Bought by
Rocha Enrique and Tellez Diana
Current Estimated Value
Home Financials for this Owner
Home Financials are based on the most recent Mortgage that was taken out on this home.
Original Mortgage
$391,000
Outstanding Balance
$311,266
Interest Rate
3.41%
Mortgage Type
New Conventional
Estimated Equity
$497,639
Purchase Details
Closed on
May 27, 1994
Sold by
Valencia Javier B and Valencia Eva M
Bought by
Brown James A and Brown Ana M
Home Financials for this Owner
Home Financials are based on the most recent Mortgage that was taken out on this home.
Original Mortgage
$136,800
Interest Rate
8.56%
Purchase Details
Closed on
Feb 6, 1991
Create a Home Valuation Report for This Property
The Home Valuation Report is an in-depth analysis detailing your home's value as well as a comparison with similar homes in the area
Home Values in the Area
Average Home Value in this Area
Purchase History
| Date | Buyer | Sale Price | Title Company |
|---|---|---|---|
| Rocha Enrique | -- | Lawyers Title Sd | |
| Brown James A | $152,000 | First American Title | |
| -- | $161,000 | -- |
Source: Public Records
Mortgage History
| Date | Status | Borrower | Loan Amount |
|---|---|---|---|
| Open | Rocha Enrique | $391,000 | |
| Closed | Brown James A | $136,800 |
Source: Public Records
Tax History
| Year | Tax Paid | Tax Assessment Tax Assessment Total Assessment is a certain percentage of the fair market value that is determined by local assessors to be the total taxable value of land and additions on the property. | Land | Improvement |
|---|---|---|---|---|
| 2025 | $5,447 | $479,529 | $220,840 | $258,689 |
| 2024 | $5,447 | $470,127 | $216,510 | $253,617 |
| 2023 | $5,372 | $460,910 | $212,265 | $248,645 |
| 2022 | $5,216 | $451,873 | $208,103 | $243,770 |
| 2021 | $5,094 | $443,014 | $204,023 | $238,991 |
| 2020 | $4,972 | $438,472 | $201,931 | $236,541 |
| 2019 | $4,842 | $429,875 | $197,972 | $231,903 |
| 2018 | $4,766 | $421,447 | $194,091 | $227,356 |
| 2017 | $4,665 | $413,185 | $190,286 | $222,899 |
| 2016 | $4,555 | $405,084 | $186,555 | $218,529 |
| 2015 | $4,489 | $399,000 | $183,753 | $215,247 |
| 2014 | $2,354 | $210,736 | $97,051 | $113,685 |
Source: Public Records
Map
Nearby Homes
- 939 Nolan Way
- 953 Maria Way
- 902 Monterey Ct
- 445 Montcalm St
- 476 Montclair St
- 466 Thrush St
- 1267 Melrose Ave
- 927 Agua Tibia Ave
- 1324 Park Dr
- 202 E J St
- 161 E Palomar St
- 1008 Calma Dr
- 45 El Capitan Dr
- 991 Calma Dr
- 607 E J St
- 712 Paseo Del Rey
- 1268 Helix Ave
- 664 Rainbow Dr
- 1201 Halley Ct
- 655 Robert Ave
Your Personal Tour Guide
Ask me questions while you tour the home.