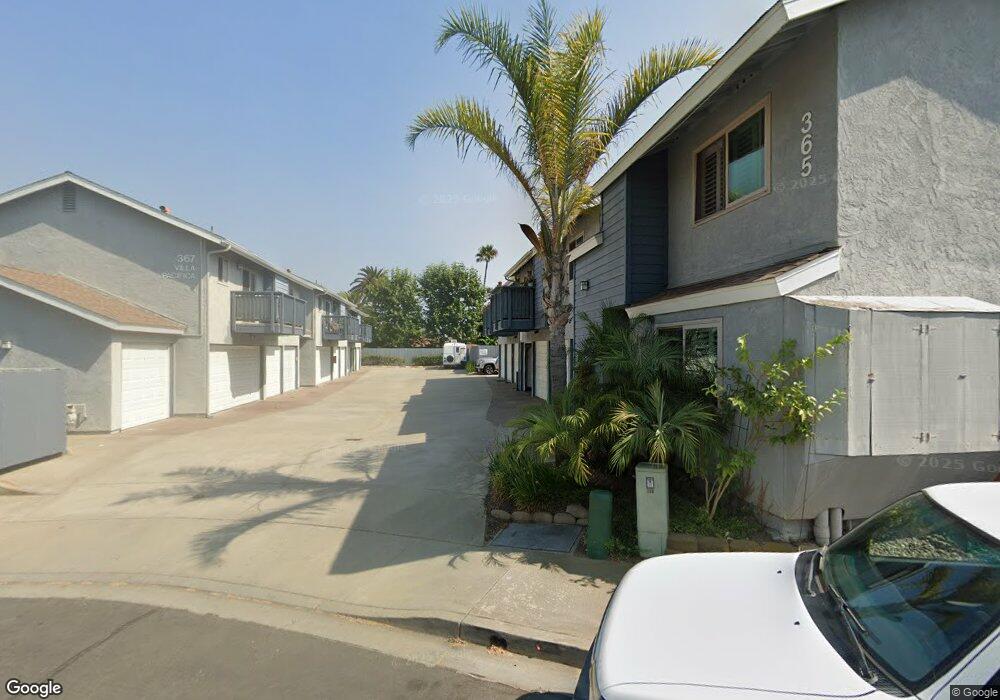
367 Hemlock Ave Unit C Carlsbad, CA 92008
North Beach NeighborhoodEstimated Value: $772,628 - $923,000
2
Beds
2
Baths
779
Sq Ft
$1,091/Sq Ft
Est. Value
About This Home
This home is located at 367 Hemlock Ave Unit C, Carlsbad, CA 92008 and is currently estimated at $850,157, approximately $1,091 per square foot. 367 Hemlock Ave Unit C is a home located in San Diego County with nearby schools including Carlsbad High School, Sage Creek High, and St. Patrick Catholic School.
Ownership History
Date
Name
Owned For
Owner Type
Purchase Details
Closed on
Aug 21, 2021
Sold by
Davis John Allen and Davis Dena M
Bought by
Davis John A and Davis Dena M
Current Estimated Value
Home Financials for this Owner
Home Financials are based on the most recent Mortgage that was taken out on this home.
Original Mortgage
$350,000
Outstanding Balance
$315,173
Interest Rate
2.7%
Mortgage Type
New Conventional
Estimated Equity
$534,984
Purchase Details
Closed on
Sep 15, 2012
Sold by
Davis John A and Davis Dena M
Bought by
Davis John A and Davis Dena M
Purchase Details
Closed on
Nov 7, 2007
Sold by
Brunings Elrich G
Bought by
The John A & Dena M Davis Revocable Tr
Purchase Details
Closed on
Oct 30, 2006
Sold by
Socrates Condominium Homes Llc
Bought by
Brunings Elrich G
Home Financials for this Owner
Home Financials are based on the most recent Mortgage that was taken out on this home.
Original Mortgage
$360,000
Interest Rate
8%
Mortgage Type
New Conventional
Create a Home Valuation Report for This Property
The Home Valuation Report is an in-depth analysis detailing your home's value as well as a comparison with similar homes in the area
Home Values in the Area
Average Home Value in this Area
Purchase History
| Date | Buyer | Sale Price | Title Company |
|---|---|---|---|
| Davis John A | -- | Fidelity Natl Ttl San Diego | |
| Davis John Allen | -- | Fidelity Natl Ttl San Diego | |
| Davis John A | -- | Lawyers Title | |
| The John A & Dena M Davis Revocable Tr | $360,000 | Old Republic Title Company | |
| Brunings Elrich G | $450,000 | Stewart Title Of Ca Inc |
Source: Public Records
Mortgage History
| Date | Status | Borrower | Loan Amount |
|---|---|---|---|
| Open | Davis John Allen | $350,000 | |
| Previous Owner | Brunings Elrich G | $360,000 |
Source: Public Records
Tax History
| Year | Tax Paid | Tax Assessment Tax Assessment Total Assessment is a certain percentage of the fair market value that is determined by local assessors to be the total taxable value of land and additions on the property. | Land | Improvement |
|---|---|---|---|---|
| 2025 | $4,967 | $472,852 | $341,508 | $131,344 |
| 2024 | $4,967 | $463,581 | $334,812 | $128,769 |
| 2023 | $4,941 | $454,493 | $328,248 | $126,245 |
| 2022 | $4,865 | $445,582 | $321,812 | $123,770 |
| 2021 | $4,829 | $436,846 | $315,502 | $121,344 |
| 2020 | $4,796 | $432,367 | $312,267 | $120,100 |
| 2019 | $4,710 | $423,891 | $306,145 | $117,746 |
| 2018 | $4,511 | $415,581 | $300,143 | $115,438 |
| 2017 | $4,436 | $407,433 | $294,258 | $113,175 |
| 2016 | $4,258 | $399,445 | $288,489 | $110,956 |
| 2015 | $4,241 | $393,446 | $284,156 | $109,290 |
| 2014 | $4,170 | $385,740 | $278,590 | $107,150 |
Source: Public Records
Map
Nearby Homes
- 370 Tamarack Ave
- 256 Juniper Ave Unit B6
- 150 Juniper Ave
- 378 Acacia Ave
- 141 Cherry Ave
- 324 Chinquapin Ave
- 320 Chinquapin Ave
- 318 Chinquapin Ave
- 175 Maple Ave Unit 4
- 157 Maple Ave
- 4008 Aguila St Unit I
- 4011 Layang Cir Unit F
- 3258 Tyler St
- 4020 Layang Cir Unit C
- 4021 Layang Cir Unit A
- 3177 Lincoln St
- 3747 Adams St
- 735 Pine Ave
- 737 Pine Ave
- 4031 Aidan Cir Unit 1205
- 367 Hemlock Ave
- 367 Hemlock Ave Unit B
- 367 Hemlock Ave Unit A
- 365 Hemlock Ave Unit E
- 365 Hemlock Ave Unit D
- 365 Hemlock Ave Unit C
- 365 Hemlock Ave Unit B
- 365 Hemlock Ave Unit A
- 363 Hemlock Ave
- 363 Hemlock Ave Unit C
- 363 Hemlock Ave Unit B
- 363 Hemlock Ave Unit A
- 360 Redwood Ave
- 370 Redwood Ave
- 355 Hemlock Ave
- 350 Redwood Ave
- 380 Hemlock Ave
- 384 Hemlock Ave
- 391 Redwood Ave
- 386 Hemlock Ave Unit 1
Your Personal Tour Guide
Ask me questions while you tour the home.