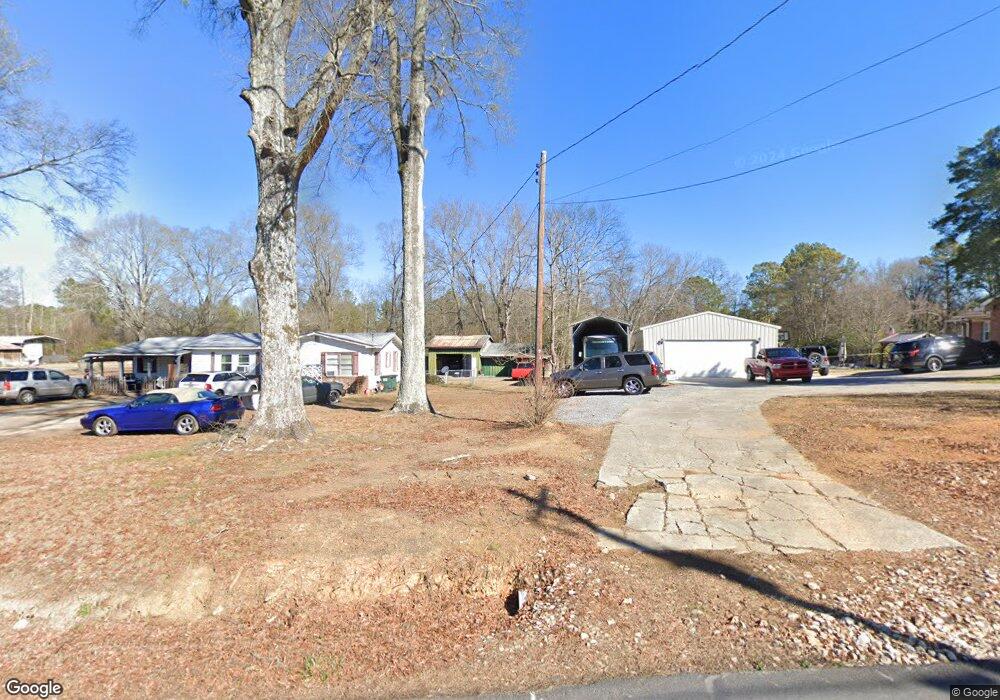
367 River Bend Rd SW Plainville, GA 30733
Estimated Value: $293,000 - $390,000
3
Beds
2
Baths
1,855
Sq Ft
$183/Sq Ft
Est. Value
About This Home
This home is located at 367 River Bend Rd SW, Plainville, GA 30733 and is currently estimated at $339,071, approximately $182 per square foot. 367 River Bend Rd SW is a home located in Gordon County with nearby schools including Swain Elementary School, Ashworth Middle School, and Gordon Central High School.
Ownership History
Date
Name
Owned For
Owner Type
Purchase Details
Closed on
Apr 16, 2024
Sold by
Smeed Keith A
Bought by
Smeed Cheryl and Smeed Keith A
Current Estimated Value
Home Financials for this Owner
Home Financials are based on the most recent Mortgage that was taken out on this home.
Original Mortgage
$100,000
Outstanding Balance
$98,503
Interest Rate
6.87%
Mortgage Type
New Conventional
Estimated Equity
$240,568
Purchase Details
Closed on
Nov 28, 2006
Sold by
Coulter Benjamin H
Bought by
Nicholson Jeremiah B and Nicholson Christy
Home Financials for this Owner
Home Financials are based on the most recent Mortgage that was taken out on this home.
Original Mortgage
$156,641
Interest Rate
6.29%
Mortgage Type
New Conventional
Purchase Details
Closed on
Apr 23, 2003
Sold by
Coulter Benjamin H
Bought by
Coulter Lillie B
Purchase Details
Closed on
Apr 13, 1996
Bought by
Coulter Benjamin H
Create a Home Valuation Report for This Property
The Home Valuation Report is an in-depth analysis detailing your home's value as well as a comparison with similar homes in the area
Home Values in the Area
Average Home Value in this Area
Purchase History
| Date | Buyer | Sale Price | Title Company |
|---|---|---|---|
| Smeed Cheryl | -- | -- | |
| Smeed Keith A | $329,000 | -- | |
| Nicholson Jeremiah B | $135,000 | -- | |
| Coulter Lillie B | -- | -- | |
| Coulter Benjamin H | -- | -- |
Source: Public Records
Mortgage History
| Date | Status | Borrower | Loan Amount |
|---|---|---|---|
| Open | Smeed Keith A | $100,000 | |
| Previous Owner | Nicholson Jeremiah B | $156,641 |
Source: Public Records
Tax History Compared to Growth
Tax History
| Year | Tax Paid | Tax Assessment Tax Assessment Total Assessment is a certain percentage of the fair market value that is determined by local assessors to be the total taxable value of land and additions on the property. | Land | Improvement |
|---|---|---|---|---|
| 2024 | $1,503 | $61,160 | $2,000 | $59,160 |
| 2023 | $1,424 | $58,040 | $2,000 | $56,040 |
| 2022 | $1,436 | $55,160 | $2,000 | $53,160 |
| 2021 | $1,266 | $47,200 | $2,000 | $45,200 |
| 2020 | $1,319 | $48,040 | $2,000 | $46,040 |
| 2019 | $1,326 | $48,040 | $2,000 | $46,040 |
| 2018 | $1,036 | $37,964 | $2,000 | $35,964 |
| 2017 | $1,010 | $36,084 | $2,000 | $34,084 |
| 2016 | $1,012 | $36,084 | $2,000 | $34,084 |
| 2015 | $1,001 | $35,404 | $2,000 | $33,404 |
| 2014 | $946 | $34,492 | $2,036 | $32,456 |
Source: Public Records
Map
Nearby Homes
- 241 Riverbend Rd SW
- 241 River Bend Rd SW
- 1211 Franklin Rd SW
- 0 Autry Rd SW Unit 414481
- 0 Autry Rd SW Unit 7549643
- 0 Autry Rd SW Unit 23053843
- 0 Autry Rd SW Unit 10489984
- 1500 Moores Ferry Rd SW
- 332 Old Calhoun Rd SW
- 159 Moores Ferry Rd SW
- 221 Hardin Rd SW
- 154 Honeysuckle Dr SW
- 3610 Rome Rd SW
- 180 Honeysuckle Vine Rd
- 3293 Rome Rd SW
- 306 Ervin Coker Rd NE
- 292 Ervin Coker Rd NE
- 187 Cantrell Dr SW
- 33 +/- ACRES Adairsville Rd Hwy 140
- 577 Everett Springs Rd SW
- 367 Riverbend Rd SW
- 381 Riverbend Rd SW
- 337 Riverbend Rd SW
- 455 Riverbend Rd SW
- 347 Riverbend Rd SW
- 362 Riverbend Rd SW
- 313 Riverbend Rd SW
- 352 Riverbend Rd SW
- 320 Riverbend Rd SW
- 460 Riverbend Rd SW
- 338 Riverbend Rd SW
- 308 Riverbend Rd SW
- 2153 Moores Ferry Rd SW
- 2177 Moores Ferry Rd SW
- 259 Riverbend Rd SW
- 290 River Bend Rd SW
- 2158 Moores Ferry Rd SW
- 454 Riverbend Rd SW
- 282 Riverbend Rd SW
- 2121 Moores Ferry Rd SW