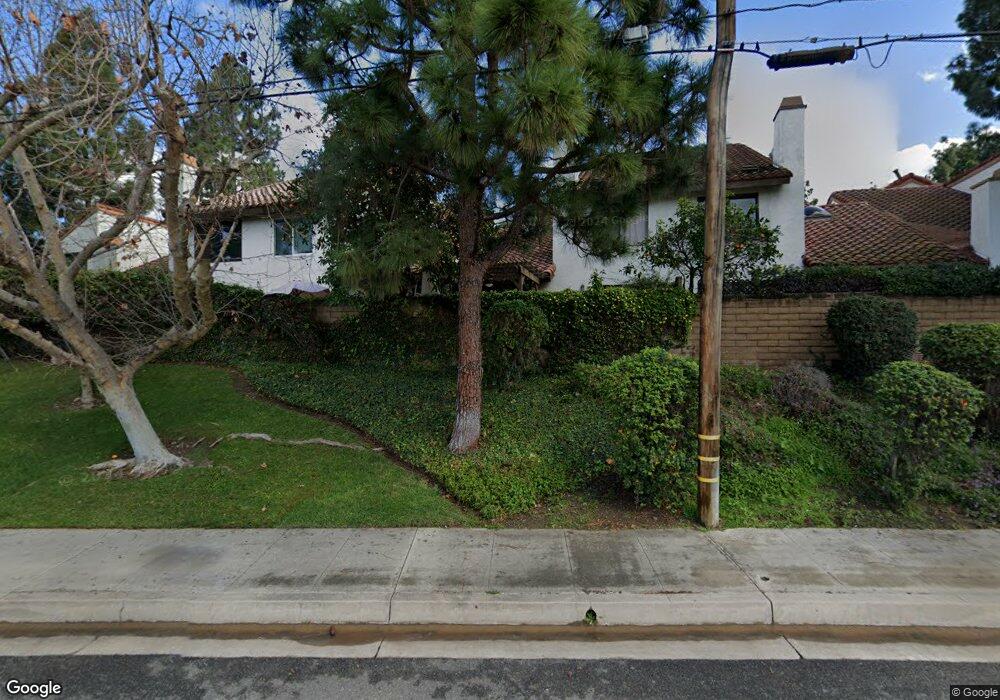
367 S Via el Modena Unit 62 Orange, CA 92869
Estimated Value: $775,000 - $921,000
3
Beds
2
Baths
1,585
Sq Ft
$528/Sq Ft
Est. Value
About This Home
This home is located at 367 S Via el Modena Unit 62, Orange, CA 92869 and is currently estimated at $836,674, approximately $527 per square foot. 367 S Via el Modena Unit 62 is a home located in Orange County with nearby schools including Jordan Academy of Language & Computer Science, El Modena High School, and Orange County Classical Academy.
Ownership History
Date
Name
Owned For
Owner Type
Purchase Details
Closed on
Jun 17, 2003
Sold by
Yeaw Stella M
Bought by
Hernandez George Y and Hernandez Verna M
Current Estimated Value
Home Financials for this Owner
Home Financials are based on the most recent Mortgage that was taken out on this home.
Original Mortgage
$276,000
Interest Rate
5.46%
Mortgage Type
Purchase Money Mortgage
Create a Home Valuation Report for This Property
The Home Valuation Report is an in-depth analysis detailing your home's value as well as a comparison with similar homes in the area
Home Values in the Area
Average Home Value in this Area
Purchase History
| Date | Buyer | Sale Price | Title Company |
|---|---|---|---|
| Hernandez George Y | $345,000 | -- |
Source: Public Records
Mortgage History
| Date | Status | Borrower | Loan Amount |
|---|---|---|---|
| Previous Owner | Hernandez George Y | $276,000 |
Source: Public Records
Tax History Compared to Growth
Tax History
| Year | Tax Paid | Tax Assessment Tax Assessment Total Assessment is a certain percentage of the fair market value that is determined by local assessors to be the total taxable value of land and additions on the property. | Land | Improvement |
|---|---|---|---|---|
| 2025 | $5,472 | $490,509 | $325,044 | $165,465 |
| 2024 | $5,472 | $480,892 | $318,671 | $162,221 |
| 2023 | $5,350 | $471,463 | $312,422 | $159,041 |
| 2022 | $5,246 | $462,219 | $306,296 | $155,923 |
| 2021 | $5,101 | $453,156 | $300,290 | $152,866 |
| 2020 | $5,054 | $448,510 | $297,211 | $151,299 |
| 2019 | $4,991 | $439,716 | $291,383 | $148,333 |
| 2018 | $4,916 | $431,095 | $285,670 | $145,425 |
| 2017 | $4,714 | $422,643 | $280,069 | $142,574 |
| 2016 | $4,624 | $414,356 | $274,577 | $139,779 |
| 2015 | $4,557 | $408,132 | $270,452 | $137,680 |
| 2014 | $4,460 | $400,138 | $265,154 | $134,984 |
Source: Public Records
Map
Nearby Homes
- 411 S Hewes St
- 429 S Hill St
- 12302 Circula Panorama
- 12306 Circula Panorama
- 12308 Circula Panorama
- 12273 Baja Panorama
- 18936 1/2 E Smiley Dr
- 12272 Media Panorama
- 12284 Circula Panorama
- 4705 E Washington Ave
- 19002 E Smiley Dr
- 12281 Alta Panorama
- 12661 Vista Panorama
- 4900 E Chapman Ave Unit 24
- 4900 E Chapman Ave Unit 62
- 4900 E Chapman Ave Unit 4
- 12352 Baja Panorama
- 12254 Circula Panorama
- 435 S Estate Dr
- 18945 Fowler Ave
- 367 S Via el Modena Unit 63
- 367 S Via el Modena Unit 4
- 367 S Via el Modena Unit 2
- 367 S Via el Modena Unit 5
- 367 S Via el Modena Unit 6
- 367 S Via el Modena Unit 3
- 393 S Via el Modena Unit 69
- 393 S Via el Modena Unit 4
- 393 S Via el Modena Unit 7
- 393 S Via el Modena Unit 73
- 393 S Via el Modena Unit 70
- 393 S Via el Modena Unit 1
- 393 S Via el Modena Unit 2
- 393 S Via el Modena Unit 72
- 368 S Via el Modena
- 368 S Via el Modena Unit 5
- 368 S Via el Modena Unit 2
- 368 S Via el Modena Unit 3
- 368 S Via el Modena Unit 1
- 368 S Via el Modena Unit 4