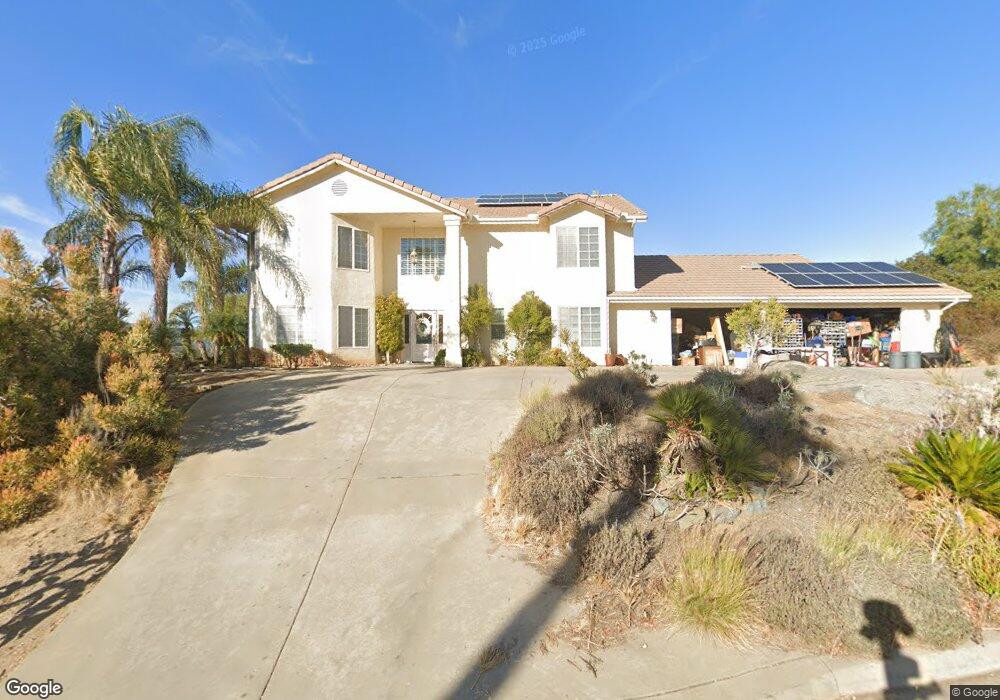
367 Sneath Way Alpine, CA 91901
Estimated Value: $1,168,686 - $1,627,000
3
Beds
4
Baths
3,258
Sq Ft
$421/Sq Ft
Est. Value
About This Home
This home is located at 367 Sneath Way, Alpine, CA 91901 and is currently estimated at $1,372,422, approximately $421 per square foot. 367 Sneath Way is a home located in San Diego County with nearby schools including Granite Hills High School, The Heights Charter, and Liberty Charter High School.
Ownership History
Date
Name
Owned For
Owner Type
Purchase Details
Closed on
Aug 7, 2002
Sold by
Richardson Darcy N and Richardson Carole
Bought by
Malboeuf Timothy
Current Estimated Value
Home Financials for this Owner
Home Financials are based on the most recent Mortgage that was taken out on this home.
Original Mortgage
$440,000
Outstanding Balance
$184,009
Interest Rate
6.52%
Mortgage Type
Stand Alone First
Estimated Equity
$1,188,413
Purchase Details
Closed on
Mar 3, 2000
Sold by
Landsberg Kent H Trust 06-26-91
Bought by
Richardson Darcy N and Richardson Carole
Purchase Details
Closed on
Feb 9, 1994
Sold by
Landsberg Development Company
Bought by
Landsberg Kent H and Landsberg Carol P
Create a Home Valuation Report for This Property
The Home Valuation Report is an in-depth analysis detailing your home's value as well as a comparison with similar homes in the area
Home Values in the Area
Average Home Value in this Area
Purchase History
| Date | Buyer | Sale Price | Title Company |
|---|---|---|---|
| Malboeuf Timothy | $580,000 | Commerce Title Company | |
| Richardson Darcy N | $15,000 | Old Republic Title Company | |
| Landsberg Kent H | -- | -- |
Source: Public Records
Mortgage History
| Date | Status | Borrower | Loan Amount |
|---|---|---|---|
| Open | Malboeuf Timothy | $440,000 |
Source: Public Records
Tax History
| Year | Tax Paid | Tax Assessment Tax Assessment Total Assessment is a certain percentage of the fair market value that is determined by local assessors to be the total taxable value of land and additions on the property. | Land | Improvement |
|---|---|---|---|---|
| 2025 | $9,444 | $840,008 | $260,690 | $579,318 |
| 2024 | $9,444 | $823,538 | $255,579 | $567,959 |
| 2023 | $9,611 | $807,391 | $250,568 | $556,823 |
| 2022 | $9,543 | $791,560 | $245,655 | $545,905 |
| 2021 | $9,819 | $776,040 | $240,839 | $535,201 |
| 2020 | $9,349 | $768,084 | $238,370 | $529,714 |
| 2019 | $9,175 | $753,025 | $233,697 | $519,328 |
| 2018 | $8,979 | $738,261 | $229,115 | $509,146 |
| 2017 | $510 | $723,786 | $224,623 | $499,163 |
| 2016 | $8,492 | $709,595 | $220,219 | $489,376 |
| 2015 | $8,159 | $675,000 | $209,000 | $466,000 |
| 2014 | $8,119 | $675,000 | $209,000 | $466,000 |
Source: Public Records
Map
Nearby Homes
- 2406 Mcdougal Place
- 720 Sky Mountain Ln
- 0 England Place
- 2638 W Victoria Dr
- 2855 N Victoria Dr
- 3006 N Victoria Dr
- 2389 Victoria Cir
- 1478 Peutz Valley Rd
- 2618 Columbine Rd
- 1394 Peutz Valley Rd
- 2501 Columbine Dr
- 2869 Polk Rd
- 2274 Boulders Ct
- 2400 Alpine Blvd Unit 148
- 2400 Alpine Blvd Unit 68
- 2400 Alpine Blvd Unit 135
- 2400 Alpine Blvd Unit 136
- 2400 Alpine Blvd Unit 47
- 1434 Marshall Rd Unit 20
- 2850 Alpine Blvd Unit 67
- 1436 Curtis Ln
- 375 Sneath Way
- 364 Sneath Way
- 1465 Curtis Ln
- 383 Sneath Way
- 1467 Curtis Ln
- 340 Sneath Way
- 396 Sneath Way
- 1468 Curtis Ln
- 1470 Curtis Ln
- 328 Sneath Way
- 319 Sneath Way
- 444 Sandler Ct
- 1444 Curtis Ln
- 412 Sandler Ct
- 2502 Starkey Way
- 426 Sneath Way
- 0000 Sneath Way
- 1483 Curtis Ln
- 387 Sneath Way
Your Personal Tour Guide
Ask me questions while you tour the home.