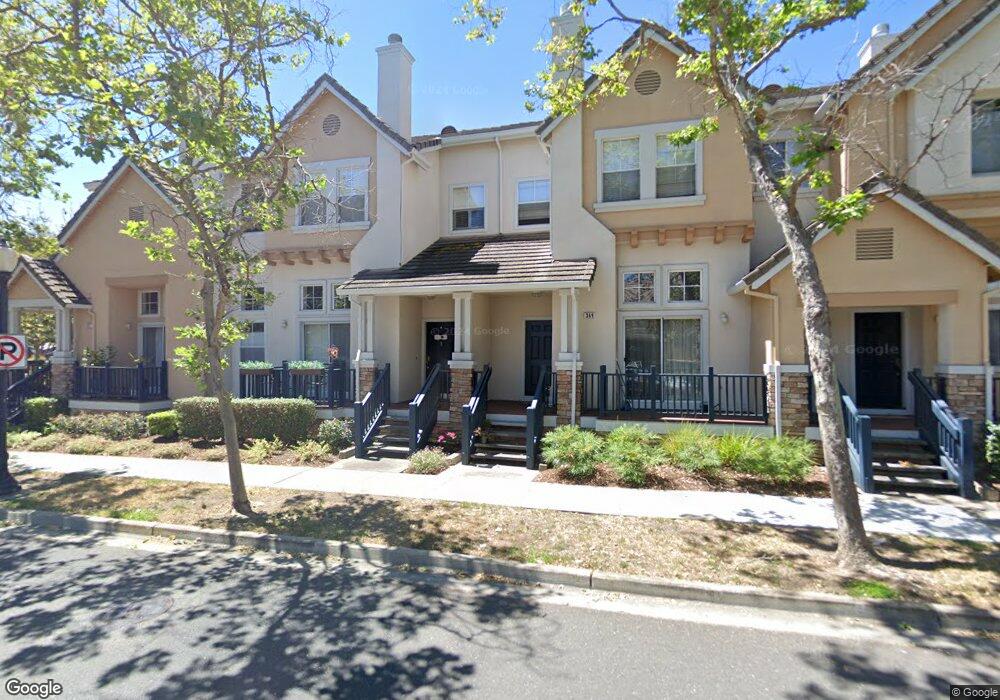
367 Snyder Ln Unit 153 Mountain View, CA 94043
Whisman NeighborhoodEstimated Value: $1,626,000 - $1,711,000
3
Beds
3
Baths
1,625
Sq Ft
$1,026/Sq Ft
Est. Value
About This Home
This home is located at 367 Snyder Ln Unit 153, Mountain View, CA 94043 and is currently estimated at $1,667,147, approximately $1,025 per square foot. 367 Snyder Ln Unit 153 is a home located in Santa Clara County with nearby schools including Edith Landels Elementary School, Crittenden Middle School, and Mountain View High School.
Ownership History
Date
Name
Owned For
Owner Type
Purchase Details
Closed on
Nov 11, 2022
Sold by
Acharya Nikhil and Acharya Poonam
Bought by
Acharya And Singh Family Revocable Trust
Current Estimated Value
Purchase Details
Closed on
Aug 15, 2006
Sold by
Li Guogang
Bought by
Acharya Nikhil and Singh Poonam
Home Financials for this Owner
Home Financials are based on the most recent Mortgage that was taken out on this home.
Original Mortgage
$76,400
Interest Rate
6.76%
Mortgage Type
Stand Alone Second
Purchase Details
Closed on
Feb 13, 2006
Sold by
Li Guoben
Bought by
Li Guoben
Purchase Details
Closed on
Dec 18, 1997
Sold by
Kaufman & Broad South Bay Inc
Bought by
Li Guoben and Yin Aie
Home Financials for this Owner
Home Financials are based on the most recent Mortgage that was taken out on this home.
Original Mortgage
$256,000
Interest Rate
7.12%
Create a Home Valuation Report for This Property
The Home Valuation Report is an in-depth analysis detailing your home's value as well as a comparison with similar homes in the area
Home Values in the Area
Average Home Value in this Area
Purchase History
| Date | Buyer | Sale Price | Title Company |
|---|---|---|---|
| Acharya And Singh Family Revocable Trust | -- | -- | |
| Acharya Nikhil | -- | -- | |
| Acharya Nikhil | $764,000 | Multiple | |
| Li Guoben | -- | None Available | |
| Li Guoben | $320,500 | First American Title Guarant |
Source: Public Records
Mortgage History
| Date | Status | Borrower | Loan Amount |
|---|---|---|---|
| Previous Owner | Acharya Nikhil | $76,400 | |
| Previous Owner | Acharya Nikhil | $611,200 | |
| Previous Owner | Li Guoben | $256,000 |
Source: Public Records
Tax History Compared to Growth
Tax History
| Year | Tax Paid | Tax Assessment Tax Assessment Total Assessment is a certain percentage of the fair market value that is determined by local assessors to be the total taxable value of land and additions on the property. | Land | Improvement |
|---|---|---|---|---|
| 2025 | $11,895 | $1,023,582 | $511,791 | $511,791 |
| 2024 | $11,895 | $1,003,512 | $501,756 | $501,756 |
| 2023 | $11,774 | $983,836 | $491,918 | $491,918 |
| 2022 | $11,744 | $964,546 | $482,273 | $482,273 |
| 2021 | $11,377 | $945,634 | $472,817 | $472,817 |
| 2020 | $11,391 | $935,938 | $467,969 | $467,969 |
| 2019 | $10,911 | $917,588 | $458,794 | $458,794 |
| 2018 | $10,797 | $899,598 | $449,799 | $449,799 |
| 2017 | $10,351 | $881,960 | $440,980 | $440,980 |
| 2016 | $10,042 | $864,668 | $432,334 | $432,334 |
| 2015 | $9,753 | $851,680 | $425,840 | $425,840 |
| 2014 | $9,664 | $834,998 | $417,499 | $417,499 |
Source: Public Records
Map
Nearby Homes
- 3418 Pyramid Way
- 427 Nicholas Dr
- 125 Orbit Way
- 163 Gladys Ave
- 201 Ada Ave Unit 25
- 198 Ada Ave
- 71 Gladys Ave
- 493 Magritte Way
- 325 Sylvan Ave
- 325 Sylvan Ave Unit 47
- 110 E Middlefield Rd Unit C
- 149 Flynn Ave
- 139 Flynn Ave
- 280 Easy St Unit 311
- 94 Flynn Ave Unit D
- 90 Flynn Ave Unit C
- 433 Sylvan Ave
- 433 Sylvan Ave Unit 84
- 99 Sherland Ave Unit B
- 280 Orchard Ave Unit K
- 369 Snyder Ln Unit 152
- 371 Snyder Ln
- 368 Flower Ln Unit 881
- 365 Snyder Ln Unit 14141
- 363 Snyder Ln
- 361 Snyder Ln
- 370 Flower Ln
- 366 Flower Ln
- 377 Pacific Dr
- 373 Pacific Dr
- 372 Flower Ln Unit 83
- 364 Flower Ln Unit 93
- 365 Pacific Dr Unit 162
- 374 Flower Ln Unit 84
- 362 Flower Ln
- 361 Pacific Dr
- 353 Snyder Ln
- 351 Snyder Ln Unit 13131
- 360 Flower Ln
- 356 Flower Ln Unit 10101