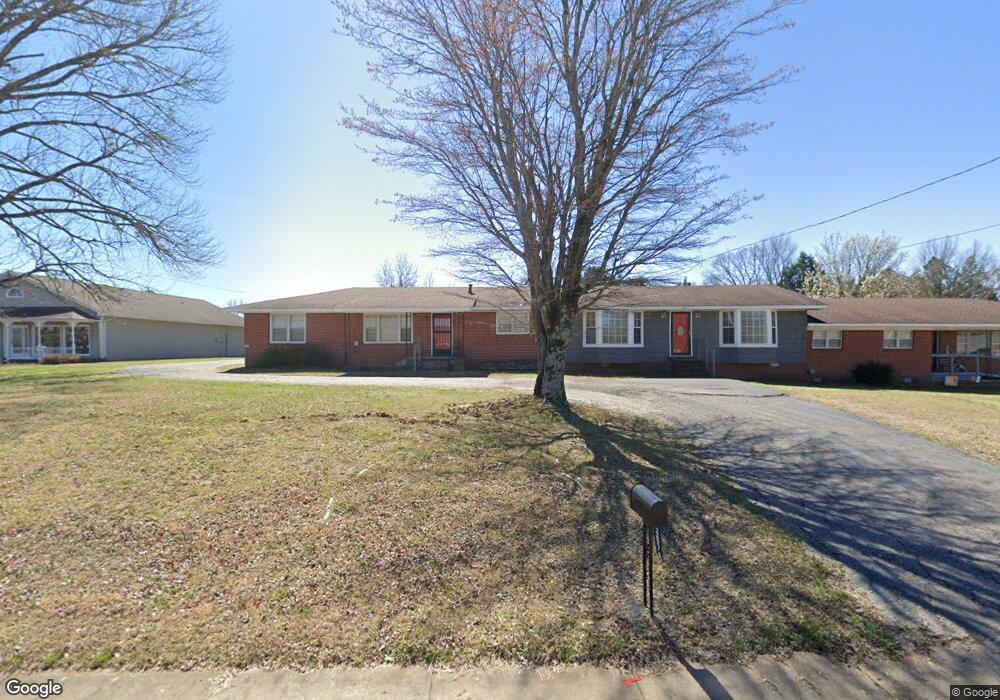
367 W Main St Parsons, TN 38363
Estimated Value: $102,000 - $214,000
--
Bed
1
Bath
2,262
Sq Ft
$75/Sq Ft
Est. Value
About This Home
This home is located at 367 W Main St, Parsons, TN 38363 and is currently estimated at $169,333, approximately $74 per square foot. 367 W Main St is a home located in Decatur County with nearby schools including Parsons Elementary School, Decaturville Elementary School, and Decatur County Middle School.
Ownership History
Date
Name
Owned For
Owner Type
Purchase Details
Closed on
Sep 23, 2025
Sold by
Myracle Stephanie Lynette
Bought by
Myracle Stephanie Lynette and Myracle Joe Paul
Current Estimated Value
Purchase Details
Closed on
Nov 27, 1991
Bought by
Houston Jack V & Mcneva
Purchase Details
Closed on
Sep 5, 1990
Bought by
Houston Jack V & Mcneva
Purchase Details
Closed on
Aug 29, 1990
Purchase Details
Closed on
Nov 28, 1959
Bought by
Hale Guy
Create a Home Valuation Report for This Property
The Home Valuation Report is an in-depth analysis detailing your home's value as well as a comparison with similar homes in the area
Home Values in the Area
Average Home Value in this Area
Purchase History
| Date | Buyer | Sale Price | Title Company |
|---|---|---|---|
| Myracle Stephanie Lynette | -- | None Listed On Document | |
| Houston Jack V & Mcneva | -- | -- | |
| Houston Jack V & Mcneva | -- | -- | |
| -- | -- | -- | |
| Hale Guy | -- | -- |
Source: Public Records
Tax History Compared to Growth
Tax History
| Year | Tax Paid | Tax Assessment Tax Assessment Total Assessment is a certain percentage of the fair market value that is determined by local assessors to be the total taxable value of land and additions on the property. | Land | Improvement |
|---|---|---|---|---|
| 2025 | -- | $57,950 | $0 | $0 |
| 2024 | -- | $25,200 | $4,150 | $21,050 |
| 2023 | $826 | $25,200 | $4,150 | $21,050 |
| 2022 | $864 | $25,200 | $4,150 | $21,050 |
| 2021 | $864 | $25,200 | $4,150 | $21,050 |
| 2020 | $864 | $25,200 | $4,150 | $21,050 |
| 2019 | $624 | $19,800 | $3,450 | $16,350 |
| 2018 | $572 | $19,800 | $3,450 | $16,350 |
| 2017 | $582 | $19,800 | $3,450 | $16,350 |
| 2016 | $586 | $19,800 | $3,450 | $16,350 |
| 2015 | $586 | $19,800 | $3,450 | $16,350 |
| 2014 | $586 | $19,796 | $0 | $0 |
Source: Public Records
Map
Nearby Homes