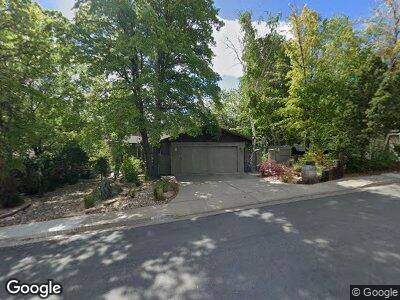
3670 Falcon Way Reno, NV 89509
West Plumb-Cashill Boulevard NeighborhoodEstimated Value: $639,000 - $679,000
3
Beds
2
Baths
1,560
Sq Ft
$420/Sq Ft
Est. Value
About This Home
This home is located at 3670 Falcon Way, Reno, NV 89509 and is currently estimated at $655,290, approximately $420 per square foot. 3670 Falcon Way is a home located in Washoe County with nearby schools including Caughlin Ranch Elementary School, Darrell C Swope Middle School, and Reno High School.
Ownership History
Date
Name
Owned For
Owner Type
Purchase Details
Closed on
Aug 12, 2017
Sold by
Cole Daniel E
Bought by
Cole Daniel E E and Daniel E And Lindsay E Cole Family Trust
Current Estimated Value
Purchase Details
Closed on
Aug 3, 2011
Sold by
Crowe Lester M and Zimmerman Heidi Z
Bought by
Cole Daniel E
Purchase Details
Closed on
Jul 21, 2004
Sold by
Taylor David Warren
Bought by
Crowe Lester M and Zimmerman Heidi C
Home Financials for this Owner
Home Financials are based on the most recent Mortgage that was taken out on this home.
Original Mortgage
$249,600
Interest Rate
6.29%
Mortgage Type
Negative Amortization
Purchase Details
Closed on
Apr 11, 2000
Sold by
Taylor Dorothy M and Taylor Charles H
Bought by
Taylor Charles H
Create a Home Valuation Report for This Property
The Home Valuation Report is an in-depth analysis detailing your home's value as well as a comparison with similar homes in the area
Home Values in the Area
Average Home Value in this Area
Purchase History
| Date | Buyer | Sale Price | Title Company |
|---|---|---|---|
| Cole Daniel E E | -- | None Available | |
| Cole Daniel E | $156,000 | First American Title Reno | |
| Crowe Lester M | $315,000 | Ticor Title Of Nevada Inc | |
| Taylor Charles H | -- | -- |
Source: Public Records
Mortgage History
| Date | Status | Borrower | Loan Amount |
|---|---|---|---|
| Closed | Cole Dan | $0 | |
| Previous Owner | Crowe Lester M | $249,600 | |
| Closed | Crowe Lester M | $31,200 |
Source: Public Records
Tax History Compared to Growth
Tax History
| Year | Tax Paid | Tax Assessment Tax Assessment Total Assessment is a certain percentage of the fair market value that is determined by local assessors to be the total taxable value of land and additions on the property. | Land | Improvement |
|---|---|---|---|---|
| 2025 | $2,212 | $93,146 | $53,620 | $39,526 |
| 2024 | $2,212 | $90,757 | $50,120 | $40,637 |
| 2023 | $2,150 | $86,936 | $47,915 | $39,021 |
| 2022 | $2,087 | $71,744 | $38,815 | $32,929 |
| 2021 | $2,028 | $66,453 | $33,250 | $33,203 |
| 2020 | $1,966 | $66,935 | $33,250 | $33,685 |
| 2019 | $1,908 | $62,681 | $29,750 | $32,931 |
| 2018 | $1,852 | $56,531 | $23,905 | $32,626 |
| 2017 | $1,798 | $55,966 | $22,960 | $33,006 |
| 2016 | $1,753 | $52,177 | $18,235 | $33,942 |
| 2015 | $1,749 | $48,486 | $14,175 | $34,311 |
| 2014 | $1,698 | $46,630 | $13,300 | $33,330 |
| 2013 | -- | $45,835 | $12,740 | $33,095 |
Source: Public Records
Map
Nearby Homes
- 3755 Heavenly Valley Ln
- 3590 Bluejay Ct
- 4104 Copper Valley Ln Unit Ascente 17
- 2382 Silver Ridge Dr
- 3623 Skyline Blvd
- 3875 Gibraltar Dr
- 2593 Chaparral Ct
- 3601 Skyline Blvd Unit 33
- 3601 Skyline Blvd Unit 3
- 3425 Skyline Blvd
- 3369 Skyline Blvd
- 3135 Villa Marbella Cir
- 3865 Piccadilly Dr
- 3140 Villa Marbella Cir
- 3650 Salerno Dr
- 3088 Cashill Blvd
- 3601 Hemlock Way
- 3061 Cashill Blvd
- 3089 Cashill Blvd Unit D1
- 3045 Cashill Blvd
- 3670 Falcon Way
- 3650 Falcon Way
- 3690 Falcon Way
- 3630 Falcon Way
- 3695 Heavenly Valley Ln
- 3720 Falcon Way
- 3685 Heavenly Valley Ln
- 3740 Falcon Way
- 3645 Falcon Way
- 3775 Heavenly Valley Ln
- 3665 Heavenly Valley Ln
- 3600 Falcon Way
- 3715 Falcon Way
- 3605 Falcon Way
- 3795 Heavenly Valley Ln
- 3645 Heavenly Valley Ln
- 3760 Falcon Way
- 3825 Heavenly Valley Ln
- 3580 Bluejay Ct
- 3725 Falcon Way