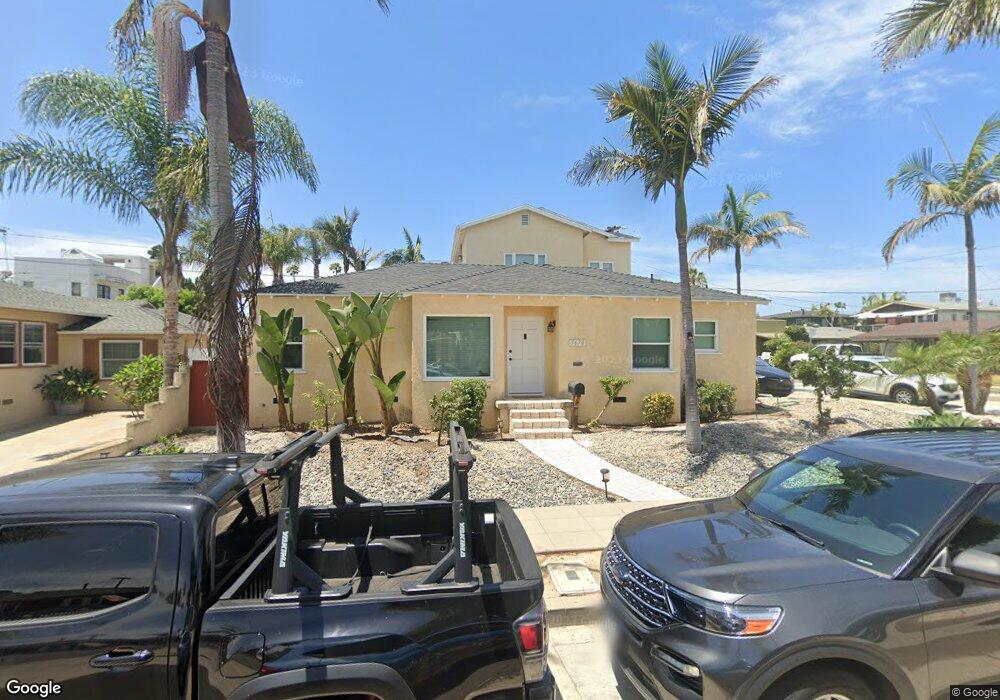
3670 Yosemite St San Diego, CA 92109
Pacific Beach NeighborhoodEstimated Value: $1,953,000 - $2,355,000
3
Beds
2
Baths
1,176
Sq Ft
$1,872/Sq Ft
Est. Value
About This Home
This home is located at 3670 Yosemite St, San Diego, CA 92109 and is currently estimated at $2,201,356, approximately $1,871 per square foot. 3670 Yosemite St is a home located in San Diego County with nearby schools including Crown Point Junior Music Academy, Pacific Beach Middle, and Mission Bay High School.
Ownership History
Date
Name
Owned For
Owner Type
Purchase Details
Closed on
Aug 21, 2006
Sold by
Hunt Mark M and Hunt Susana E
Bought by
Kim Samson
Current Estimated Value
Home Financials for this Owner
Home Financials are based on the most recent Mortgage that was taken out on this home.
Original Mortgage
$635,250
Outstanding Balance
$370,718
Interest Rate
6.25%
Mortgage Type
Purchase Money Mortgage
Estimated Equity
$1,830,638
Purchase Details
Closed on
Feb 23, 2001
Sold by
Swjt Hunt Mark M and Susana Espinosa
Bought by
Hunt Mark M and Hunt Susana E
Home Financials for this Owner
Home Financials are based on the most recent Mortgage that was taken out on this home.
Original Mortgage
$275,000
Interest Rate
6.98%
Purchase Details
Closed on
Sep 2, 1999
Sold by
Clary Jack R & Jane F Family Trust
Bought by
Hunt Mark H and Espinosa Susana
Home Financials for this Owner
Home Financials are based on the most recent Mortgage that was taken out on this home.
Original Mortgage
$300,000
Interest Rate
7.75%
Create a Home Valuation Report for This Property
The Home Valuation Report is an in-depth analysis detailing your home's value as well as a comparison with similar homes in the area
Home Values in the Area
Average Home Value in this Area
Purchase History
| Date | Buyer | Sale Price | Title Company |
|---|---|---|---|
| Kim Samson | $825,000 | Multiple | |
| Hunt Mark M | -- | First American Title Ins Co | |
| Hunt Mark H | $375,000 | Commonwealth Land Title Co |
Source: Public Records
Mortgage History
| Date | Status | Borrower | Loan Amount |
|---|---|---|---|
| Open | Kim Samson | $635,250 | |
| Previous Owner | Hunt Mark M | $275,000 | |
| Previous Owner | Hunt Mark H | $300,000 | |
| Closed | Hunt Mark H | $56,250 | |
| Closed | Hunt Mark M | $145,000 |
Source: Public Records
Tax History Compared to Growth
Tax History
| Year | Tax Paid | Tax Assessment Tax Assessment Total Assessment is a certain percentage of the fair market value that is determined by local assessors to be the total taxable value of land and additions on the property. | Land | Improvement |
|---|---|---|---|---|
| 2025 | $14,933 | $1,232,973 | $937,845 | $295,128 |
| 2024 | $14,933 | $1,208,798 | $919,456 | $289,342 |
| 2023 | $14,600 | $1,185,097 | $901,428 | $283,669 |
| 2022 | $14,212 | $1,161,860 | $883,753 | $278,107 |
| 2021 | $14,113 | $1,139,079 | $866,425 | $272,654 |
| 2020 | $13,941 | $1,127,400 | $857,541 | $269,859 |
| 2019 | $13,693 | $1,105,295 | $840,727 | $264,568 |
| 2018 | $12,802 | $1,083,624 | $824,243 | $259,381 |
| 2017 | $80 | $950,000 | $785,000 | $165,000 |
| 2016 | $10,051 | $850,000 | $719,000 | $131,000 |
| 2015 | $10,052 | $850,000 | $719,000 | $131,000 |
| 2014 | $9,500 | $800,000 | $677,000 | $123,000 |
Source: Public Records
Map
Nearby Homes
- 3736 Promontory St
- 3705 Haines St
- 3616 Buena Vista St
- 3825 Kendall St
- 3850 Riviera Dr Unit 3B
- 3920 Riviera Dr Unit A
- 3328 Crown Point Dr
- 4053-55 Jewell St
- 3955 Honeycutt St Unit 201
- 4073 Riviera Dr
- 4071 Riviera Dr
- 3991 Crown Point Dr Unit P13
- 1235 Parker Place Unit 3J
- 1235 Parker Place Unit 2B
- 1221 Parker Place Unit 15
- 4135 Fanuel St
- 1152-54 Pacific Beach Dr
- 1807 Grand Ave
- 1300 Grand Ave Unit 38, 39
- 2125 Reed Ave
- 3664 Yosemite St
- 1617 Moorland Dr
- 3663 Ingraham St
- 3657 Ingraham St
- 3656 Yosemite St
- 1620 Moorland Dr
- 3671 Yosemite St
- 1626 Moorland Dr
- 3663 Yosemite St
- 1612 Moorland Dr Unit 14
- 3651 Ingraham St
- 1604 Moorland Dr
- 3652 Yosemite St
- 3657 Yosemite St
- 3645 Ingraham St
- 3701 Yosemite St
- 3651 Yosemite St
- 3684 Jewell St
- 3680 Jewell St
- 3710 Yosemite St