
Seller's Agent in 2026
Andrea Morales
Compass
(510) 579-7561
32 Total Sales
Estimated Value: $1,169,000 - $1,348,620
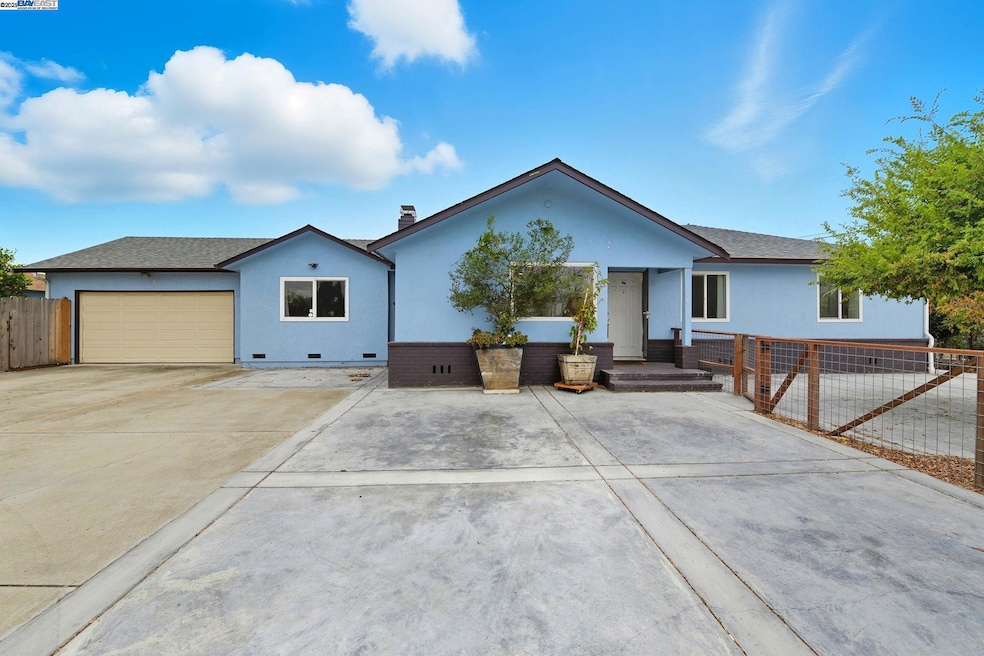
***Partition Sale subject to court confirmation and overbid. Hearing date for this sale is December 18, 2025. Welcome to 36701 Olive Street, a beautifully updated home situated on a desirable corner lot in one of Newark’s most sought-after neighborhoods. This nearly 1,993 Sq Ft residence offers the perfect blend of comfort, style, and functionality. Step inside to discover a bright, open-concept floor plan with spacious living areas, natural light, and tasteful modern updates throughout. The remodeled kitchen and bathrooms feature contemporary finishes and thoughtful details, creating a move-in ready space. The property also includes a detached bonus unit, ideal for guests, a home office, or additional income potential. Outside, the generous lot provides abundant parking and multiple outdoor spaces to enjoy — including a charming garden along the right side of the home with grapevines and persimmon trees. Excellent location close to many conveniences such as I-880, Dumbarton Bridge, Meta campus, and near shopping and dining at NewPark Mall and Pacific Commons.
We collect this data history from publicly available records. To have your information removed, we recommend requesting removal directly through your county’s website.
We collect this data history from publicly available records. To have your information removed, we recommend requesting removal directly through your county’s website.
| Date | Buyer | Sale Price | Title Company |
|---|---|---|---|
| $1,211,000 | Chicago Title | ||
| -- | First American Title Company | ||
| $810,000 | First American Title Company | ||
| $621,000 | Chicago Title Company | ||
| -- | Chicago Title Company | ||
| -- | Chicago Title Company | ||
| -- | None Available | ||
| -- | Commonwealth Land Title Co | ||
| -- | Commonwealth Land Title Co | ||
| -- | -- | ||
| -- | -- |
We collect this data history from publicly available records. To have your information removed, we recommend requesting removal directly through your county’s website.
| Date | Status | Borrower | Loan Amount |
|---|---|---|---|
| Open | $968,600 | ||
| Previous Owner | $636,000 | ||
| Previous Owner | $92,900 | ||
| Previous Owner | $478,150 | ||
| Previous Owner | $80,000 |
We collect this data history from publicly available records. To have your information removed, we recommend requesting removal directly through your county’s website.
| Date | Event | Price | List to Sale | Price per Sq Ft | Prior Sale |
|---|---|---|---|---|---|
| 01/21/2026 01/21/26 | Sold | $1,210,750 | +4.3% | $608 / Sq Ft | |
| 12/19/2025 12/19/25 | Pending | -- | -- | -- | |
| 11/21/2025 11/21/25 | Price Changed | $1,160,750 | +5.7% | $582 / Sq Ft | |
| 10/17/2025 10/17/25 | For Sale | $1,098,000 | +35.6% | $551 / Sq Ft | |
| 03/20/2017 03/20/17 | Sold | $810,000 | -1.1% | $406 / Sq Ft | View Prior Sale |
| 01/23/2017 01/23/17 | Pending | -- | -- | -- | |
| 01/13/2017 01/13/17 | For Sale | $819,000 | 0.0% | $411 / Sq Ft | |
| 12/01/2016 12/01/16 | Pending | -- | -- | -- | |
| 11/21/2016 11/21/16 | For Sale | $819,000 | 0.0% | $411 / Sq Ft | |
| 11/07/2016 11/07/16 | Pending | -- | -- | -- | |
| 11/01/2016 11/01/16 | For Sale | $819,000 | +31.9% | $411 / Sq Ft | |
| 03/24/2016 03/24/16 | Sold | $621,000 | -11.2% | $312 / Sq Ft | View Prior Sale |
| 03/09/2016 03/09/16 | Pending | -- | -- | -- | |
| 08/31/2015 08/31/15 | For Sale | $699,000 | -- | $351 / Sq Ft |
We collect this data history from publicly available records. To have your information removed, we recommend requesting removal directly through your county’s website.
| Year | Tax Paid | Tax Assessment Tax Assessment Total Assessment is a certain percentage of the fair market value that is determined by local assessors to be the total taxable value of land and additions on the property. | Land | Improvement |
|---|---|---|---|---|
| 2025 | $11,388 | $940,053 | $301,745 | $638,308 |
| 2024 | $11,388 | $921,625 | $295,830 | $625,795 |
| 2023 | $11,089 | $903,555 | $290,030 | $613,525 |
| 2022 | $10,961 | $885,839 | $284,343 | $601,496 |
| 2021 | $10,686 | $868,473 | $278,769 | $589,704 |
| 2020 | $10,578 | $859,572 | $275,912 | $583,660 |
| 2019 | $10,426 | $842,724 | $270,504 | $572,220 |
| 2018 | $10,274 | $826,200 | $265,200 | $561,000 |
| 2017 | $7,946 | $633,420 | $244,800 | $388,620 |
| 2016 | $5,675 | $436,096 | $130,627 | $305,469 |
| 2015 | $5,656 | $429,548 | $128,665 | $300,883 |
| 2014 | $5,502 | $421,137 | $126,146 | $294,991 |
Seller's Agent in 2026
Andrea Morales
Compass
(510) 579-7561
32 Total Sales
Seller Co-Listing Agent in 2026
Allison Chapleau
Vanguard Properties
(415) 516-0648
137 Total Sales
Buyer's Agent in 2026
Trisha Tuyen Ho
(408) 203-7986
45 Total Sales
R
Seller's Agent in 2017
Raymond Hong Vo
Foothill Estates
Buyer's Agent in 2017
Jas Bains
Intero Real Estate Services
(510) 386-8830
5 Total Sales
Seller's Agent in 2016
Nora Pascua
First Realty Advisors
(209) 302-4586
12 Total Sales
Source: Bay East Association of REALTORS®
MLS Number: 41115067
APN: 092-0026-003-00
Disclaimer: Certain information contained herein is derived from information provided by parties other than Homes.com. All information provided is deemed reliable, but is not guaranteed to be accurate and should be independently verified.
![]() Bay East ©2026. CCAR ©2026. bridgeMLS ©2026. Information Deemed Reliable But Not Guaranteed. This information is being provided by the Bay East MLS, or CCAR MLS, or bridgeMLS. The listings presented here may or may not be listed by the Broker/Agent operating this website. This information is intended for the personal use of consumers and may not be used for any purpose other than to identify prospective properties consumers may be interested in purchasing.
Bay East ©2026. CCAR ©2026. bridgeMLS ©2026. Information Deemed Reliable But Not Guaranteed. This information is being provided by the Bay East MLS, or CCAR MLS, or bridgeMLS. The listings presented here may or may not be listed by the Broker/Agent operating this website. This information is intended for the personal use of consumers and may not be used for any purpose other than to identify prospective properties consumers may be interested in purchasing.
Ask me questions while you tour the home.