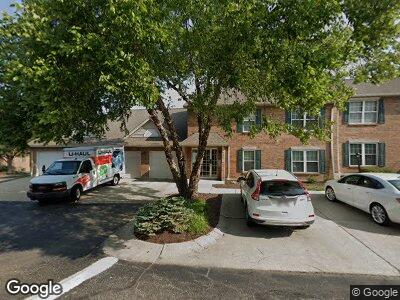
3671 W Galbraith Rd Unit 7 Cincinnati, OH 45247
Estimated Value: $172,878 - $175,000
2
Beds
2
Baths
1,180
Sq Ft
$147/Sq Ft
Est. Value
About This Home
This home is located at 3671 W Galbraith Rd Unit 7, Cincinnati, OH 45247 and is currently estimated at $173,970, approximately $147 per square foot. 3671 W Galbraith Rd Unit 7 is a home located in Hamilton County with nearby schools including Colerain Elementary School, Colerain Middle School, and Colerain High School.
Ownership History
Date
Name
Owned For
Owner Type
Purchase Details
Closed on
Jan 14, 2017
Sold by
Stephens Cecila M
Bought by
Dianne L Sherer
Current Estimated Value
Home Financials for this Owner
Home Financials are based on the most recent Mortgage that was taken out on this home.
Interest Rate
4.12%
Purchase Details
Closed on
Jan 6, 2017
Sold by
Stephens Cecilia M
Bought by
Sherer Dianne L
Home Financials for this Owner
Home Financials are based on the most recent Mortgage that was taken out on this home.
Interest Rate
4.12%
Purchase Details
Closed on
Jan 6, 1998
Sold by
May Construction Of Cincinnati Inc
Bought by
Stephens Cecilia M
Home Financials for this Owner
Home Financials are based on the most recent Mortgage that was taken out on this home.
Original Mortgage
$105,000
Interest Rate
7.24%
Create a Home Valuation Report for This Property
The Home Valuation Report is an in-depth analysis detailing your home's value as well as a comparison with similar homes in the area
Home Values in the Area
Average Home Value in this Area
Purchase History
| Date | Buyer | Sale Price | Title Company |
|---|---|---|---|
| Dianne L Sherer | $60,000 | -- | |
| Sherer Dianne L | $50,000 | -- | |
| Stephens Cecilia M | $97,100 | -- |
Source: Public Records
Mortgage History
| Date | Status | Borrower | Loan Amount |
|---|---|---|---|
| Closed | Dianne L Sherer | -- | |
| Open | Sherer Dianne L | $30,000 | |
| Previous Owner | Stephens Cecilia M | $105,000 |
Source: Public Records
Tax History Compared to Growth
Tax History
| Year | Tax Paid | Tax Assessment Tax Assessment Total Assessment is a certain percentage of the fair market value that is determined by local assessors to be the total taxable value of land and additions on the property. | Land | Improvement |
|---|---|---|---|---|
| 2024 | $2,273 | $42,578 | $7,000 | $35,578 |
| 2023 | $2,287 | $42,578 | $7,000 | $35,578 |
| 2022 | $1,300 | $19,691 | $4,046 | $15,645 |
| 2021 | $1,289 | $19,691 | $4,046 | $15,645 |
| 2020 | $1,303 | $19,691 | $4,046 | $15,645 |
| 2019 | $1,394 | $19,691 | $4,046 | $15,645 |
| 2018 | $1,251 | $19,691 | $4,046 | $15,645 |
| 2017 | $1,185 | $19,691 | $4,046 | $15,645 |
| 2016 | $1,428 | $23,447 | $4,046 | $19,401 |
| 2015 | $1,436 | $23,447 | $4,046 | $19,401 |
| 2014 | $1,444 | $23,447 | $4,046 | $19,401 |
| 2013 | $2,018 | $34,482 | $5,950 | $28,532 |
Source: Public Records
Map
Nearby Homes
- 3701 W Galbraith Rd
- 3693 W Galbraith Rd
- 7913 Cheviot Rd
- 7914 Cheviot Rd
- 3950 Olde Savannah Dr
- 7620 Cheviot Rd
- 3414 Dolomar Dr
- 3388 Alexis Rd
- 3369 W Galbraith Rd
- 8474 Chesswood Dr
- 3333 Alexis Rd
- 3565 Lapland Dr
- 3329 Alexis Rd
- 3525 Blue Rock Rd
- 3282 Dolomar Dr
- 6711 Cheviot Rd Unit 6
- 7516 Cella Dr
- 8692 Wuest Rd
- 8750 Carrousel Park Cir
- 8714 Wuest Rd
- 3671 W Galbraith Rd Unit 8
- 3671 W Galbraith Rd Unit 5
- 3671 W Galbraith Rd Unit 7
- 3671 W Galbraith Rd Unit B6
- 3671 W Galbraith Rd
- 3671 W Galbraith Rd
- 3671 W Galbraith Rd
- 3671 W Galbraith Rd
- 3671 W Galbraith Rd Unit 6
- 3701 W Galbraith Rd Unit 52
- 3701 W Galbraith Rd Unit 50
- 3701 W Galbraith Rd Unit 49
- 3701 W Galbraith Rd Unit 52
- 3701 W Galbraith Rd Unit 51
- 3701 W Galbraith Rd Unit 49
- 3701 W Galbraith Rd Unit 51
- 3701 W Galbraith Rd Unit 50
- 3675 W Galbraith Rd Unit 13
- 3675 W Galbraith Rd Unit 15
- 3675 W Galbraith Rd Unit 16