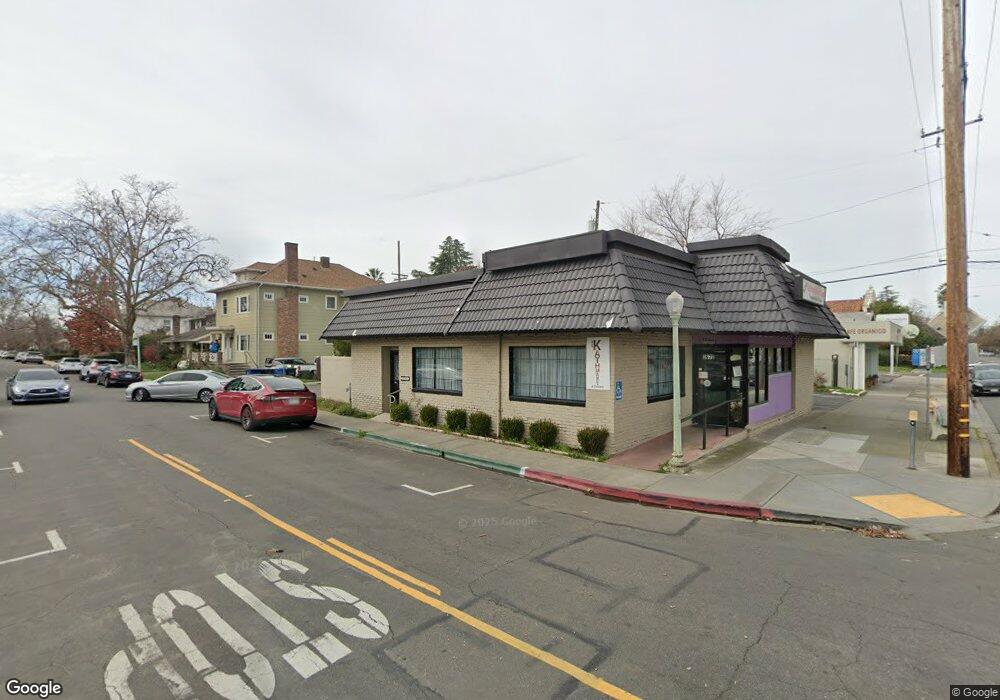
3672 J St Sacramento, CA 95816
East Sacramento NeighborhoodEstimated Value: $1,064,532
Studio
--
Bath
2,095
Sq Ft
$508/Sq Ft
Est. Value
About This Home
This home is located at 3672 J St, Sacramento, CA 95816 and is currently estimated at $1,064,532, approximately $508 per square foot. 3672 J St is a home located in Sacramento County with nearby schools including David Lubin Elementary, Miwok Middle School, and Hiram W. Johnson High School.
Ownership History
Date
Name
Owned For
Owner Type
Purchase Details
Closed on
Dec 2, 2005
Sold by
Gee Joseph P and Gee Jim Lucia K
Bought by
Gee Joseph P and Gee Jim Lucia K
Current Estimated Value
Purchase Details
Closed on
Feb 23, 2005
Sold by
Harman Leon W and The Leon W & Arline T Harman F
Bought by
Gee Joseph P and Gee Jim Lucia K
Purchase Details
Closed on
Mar 29, 1996
Sold by
Trunnell John F and Trunnell Belle H
Bought by
Harman Leon W and Harman Arline T
Create a Home Valuation Report for This Property
The Home Valuation Report is an in-depth analysis detailing your home's value as well as a comparison with similar homes in the area
Home Values in the Area
Average Home Value in this Area
Purchase History
| Date | Buyer | Sale Price | Title Company |
|---|---|---|---|
| Gee Joseph P | -- | -- | |
| Gee Joseph P | $700,000 | North American Title Co | |
| Harman Leon W | $300,000 | Old Republic Title Company |
Source: Public Records
Tax History
| Year | Tax Paid | Tax Assessment Tax Assessment Total Assessment is a certain percentage of the fair market value that is determined by local assessors to be the total taxable value of land and additions on the property. | Land | Improvement |
|---|---|---|---|---|
| 2025 | $11,410 | $975,722 | $487,861 | $487,861 |
| 2024 | $11,410 | $956,592 | $478,296 | $478,296 |
| 2023 | $11,142 | $937,836 | $468,918 | $468,918 |
| 2022 | $10,956 | $919,448 | $459,724 | $459,724 |
| 2021 | $10,436 | $901,420 | $450,710 | $450,710 |
| 2020 | $10,528 | $892,178 | $446,089 | $446,089 |
| 2019 | $10,304 | $874,686 | $437,343 | $437,343 |
| 2018 | $10,038 | $857,536 | $428,768 | $428,768 |
| 2017 | $9,904 | $840,722 | $420,361 | $420,361 |
| 2016 | $9,730 | $824,238 | $412,119 | $412,119 |
| 2015 | $9,592 | $811,858 | $405,929 | $405,929 |
| 2014 | $9,332 | $795,956 | $397,978 | $397,978 |
Source: Public Records
Map
Nearby Homes
Your Personal Tour Guide
Ask me questions while you tour the home.