Estimated Value: $472,000 - $741,741
3
Beds
1
Bath
2,334
Sq Ft
$248/Sq Ft
Est. Value
About This Home
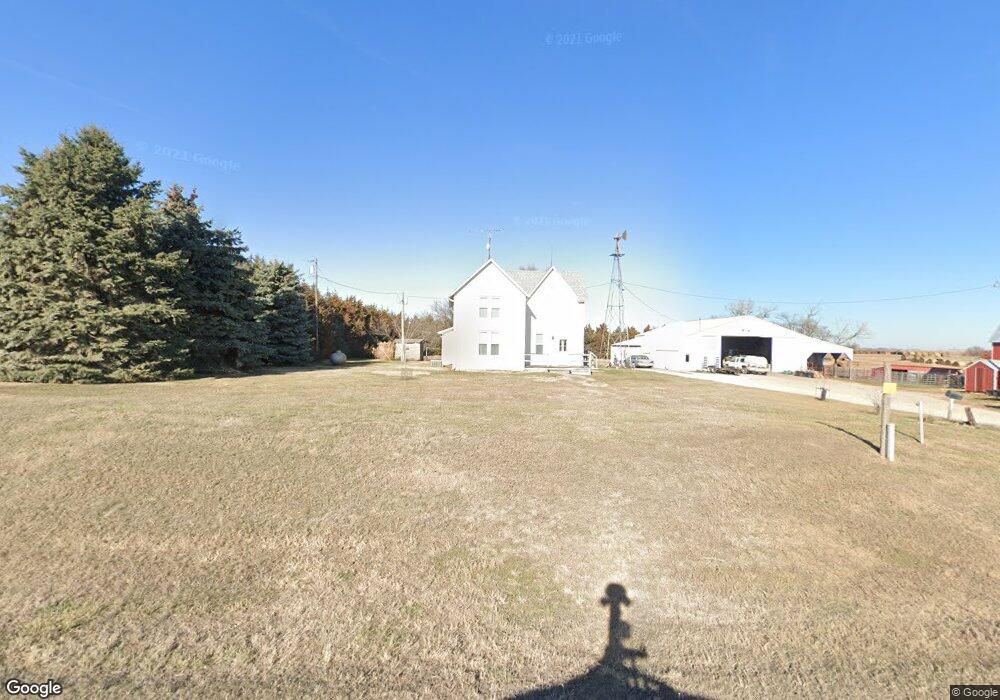
This home is located at 3673 R Rd, Cook, NE 68329 and is currently estimated at $579,185, approximately $248 per square foot. 3673 R Rd is a home with nearby schools including Johnson County Central Elementary School - Cook, Johnson County Central Elementary School - Tecumseh, and Johnson County Central Middle School.
Ownership History
Date
Name
Owned For
Owner Type
Purchase Details
Closed on
Sep 10, 2009
Sold by
Moeller Ray A and Moeller Naomi K
Bought by
Niedermeyer Jared R
Current Estimated Value
Home Financials for this Owner
Home Financials are based on the most recent Mortgage that was taken out on this home.
Original Mortgage
$250,000
Outstanding Balance
$200,649
Interest Rate
4.87%
Mortgage Type
USDA
Estimated Equity
$378,536
Purchase Details
Closed on
Apr 22, 2006
Sold by
Smith Mary Jane and Smith Ralph E
Bought by
Niedermeyer Robert R and Niedermeyer Debra R
Home Financials for this Owner
Home Financials are based on the most recent Mortgage that was taken out on this home.
Original Mortgage
$14,000
Interest Rate
6.36%
Mortgage Type
Unknown
Create a Home Valuation Report for This Property
The Home Valuation Report is an in-depth analysis detailing your home's value as well as a comparison with similar homes in the area
Home Values in the Area
Average Home Value in this Area
Purchase History
| Date | Buyer | Sale Price | Title Company |
|---|---|---|---|
| Niedermeyer Jared R | $250,000 | None Available | |
| Niedermeyer Robert R | -- | None Available |
Source: Public Records
Mortgage History
| Date | Status | Borrower | Loan Amount |
|---|---|---|---|
| Open | Niedermeyer Jared R | $250,000 | |
| Previous Owner | Niedermeyer Robert R | $14,000 |
Source: Public Records
Tax History Compared to Growth
Tax History
| Year | Tax Paid | Tax Assessment Tax Assessment Total Assessment is a certain percentage of the fair market value that is determined by local assessors to be the total taxable value of land and additions on the property. | Land | Improvement |
|---|---|---|---|---|
| 2024 | $9,715 | $745,004 | $599,362 | $145,642 |
| 2023 | $10,262 | $698,915 | $553,273 | $145,642 |
| 2022 | $9,128 | $626,839 | $511,029 | $115,810 |
| 2021 | $8,575 | $626,840 | $511,030 | $115,810 |
| 2020 | $8,481 | $616,840 | $501,030 | $115,810 |
| 2019 | $8,673 | $641,150 | $525,340 | $115,810 |
| 2018 | $8,587 | $657,410 | $541,600 | $115,810 |
| 2017 | $8,870 | $660,070 | $544,260 | $115,810 |
| 2016 | $8,862 | $661,690 | $545,880 | $115,810 |
| 2015 | $8,848 | $661,200 | $542,910 | $118,290 |
| 2014 | $8,743 | $591,100 | $472,810 | $118,290 |
| 2012 | $8,419 | $526,240 | $409,110 | $117,130 |
Source: Public Records
Map
Nearby Homes