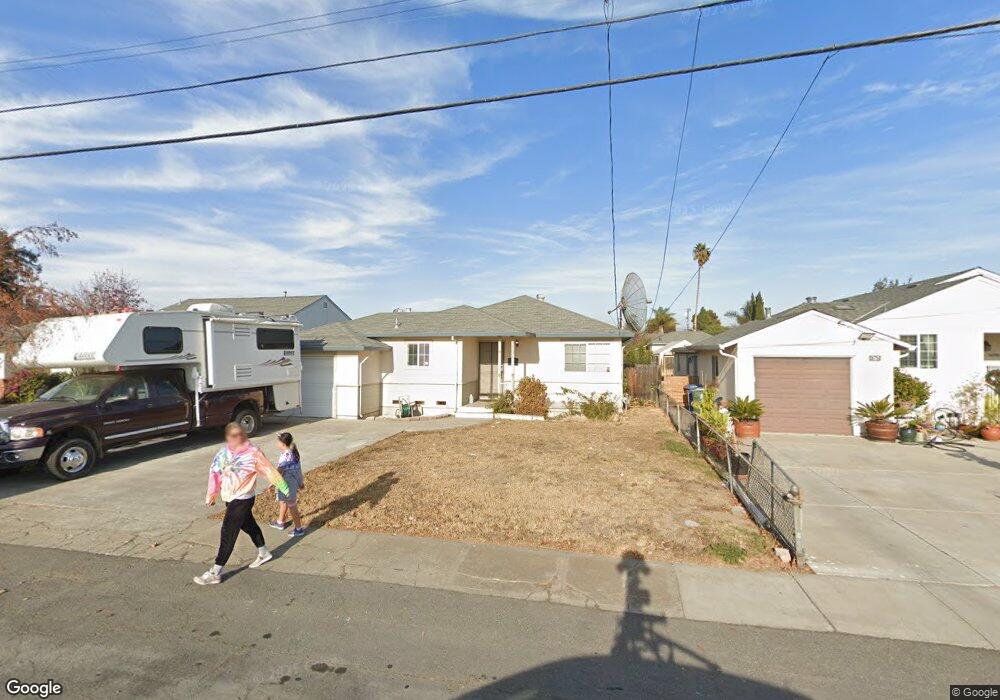
36738 Magnolia St Newark, CA 94560
Estimated Value: $879,179 - $997,000
3
Beds
1
Bath
1,022
Sq Ft
$899/Sq Ft
Est. Value
About This Home
This home is located at 36738 Magnolia St, Newark, CA 94560 and is currently estimated at $918,545, approximately $898 per square foot. 36738 Magnolia St is a home located in Alameda County with nearby schools including Coyote Hills Elementary School, Newark Junior High School, and Newark Memorial High School.
Ownership History
Date
Name
Owned For
Owner Type
Purchase Details
Closed on
Nov 14, 2016
Sold by
Murillo Claudia
Bought by
Murillo Oscar N
Current Estimated Value
Home Financials for this Owner
Home Financials are based on the most recent Mortgage that was taken out on this home.
Original Mortgage
$25,000
Interest Rate
3.54%
Mortgage Type
Credit Line Revolving
Purchase Details
Closed on
Apr 22, 1997
Sold by
Daniels Donald V 3Rd & Lisa D
Bought by
Murillomelgar Oscar Napoleon and Murillo Claudia
Home Financials for this Owner
Home Financials are based on the most recent Mortgage that was taken out on this home.
Original Mortgage
$185,600
Interest Rate
7.86%
Mortgage Type
VA
Purchase Details
Closed on
Feb 8, 1994
Sold by
Daniels Donald V and Daniels Lisa D
Bought by
Daniels Donald V and Daniels Lisa D
Create a Home Valuation Report for This Property
The Home Valuation Report is an in-depth analysis detailing your home's value as well as a comparison with similar homes in the area
Home Values in the Area
Average Home Value in this Area
Purchase History
| Date | Buyer | Sale Price | Title Company |
|---|---|---|---|
| Murillo Oscar N | -- | North American Title Co Inc | |
| Murillomelgar Oscar Napoleon | $186,000 | First American Title Guarant | |
| Daniels Donald V | -- | Northwestern Title Company |
Source: Public Records
Mortgage History
| Date | Status | Borrower | Loan Amount |
|---|---|---|---|
| Previous Owner | Murillo Oscar N | $25,000 | |
| Previous Owner | Murillomelgar Oscar Napoleon | $185,600 |
Source: Public Records
Tax History Compared to Growth
Tax History
| Year | Tax Paid | Tax Assessment Tax Assessment Total Assessment is a certain percentage of the fair market value that is determined by local assessors to be the total taxable value of land and additions on the property. | Land | Improvement |
|---|---|---|---|---|
| 2025 | $4,027 | $289,403 | $88,921 | $207,482 |
| 2024 | $4,027 | $283,591 | $87,177 | $203,414 |
| 2023 | $3,903 | $284,894 | $85,468 | $199,426 |
| 2022 | $3,833 | $272,308 | $83,792 | $195,516 |
| 2021 | $3,741 | $266,833 | $82,150 | $191,683 |
| 2020 | $3,636 | $271,026 | $81,308 | $189,718 |
| 2019 | $3,586 | $265,714 | $79,714 | $186,000 |
| 2018 | $3,528 | $260,504 | $78,151 | $182,353 |
| 2017 | $3,437 | $255,398 | $76,619 | $178,779 |
| 2016 | $3,389 | $250,391 | $75,117 | $175,274 |
| 2015 | $3,375 | $246,631 | $73,989 | $172,642 |
| 2014 | $3,279 | $241,801 | $72,540 | $169,261 |
Source: Public Records
Map
Nearby Homes
- 36702 Olive St
- 36563 Beutke Dr
- 36535 Mulberry St
- 36466 Haley St
- 36523 Cherry St
- 36976 Mulberry St
- 6364 Noel Ave
- 6416 Mayhews Landing Rd
- 36985 Walnut St
- 36593 Leone St
- 7843 Railroad Ave
- 37051 Walnut St
- 6278 Dairy Ave
- 37136 Magnolia St
- 6125 Thornton Ave Unit A
- 37282 Magnolia St
- 36184 Toulouse St
- 36913 Newark Blvd Unit C
- 6198 Civic Terrace Ave Unit A
- 7574 Birkdale Dr
- 36750 Magnolia St
- 36726 Magnolia St
- 36762 Magnolia St
- 36704 Magnolia St
- 36774 Magnolia St
- 36725 Olive St
- 36733 Olive St
- 36717 Olive St
- 36741 Olive St
- 36709 Olive St
- 6938 George Ave
- 6954 George Ave
- 6922 George Ave
- 6844 George Ave
- 36749 Olive St
- 36739 Magnolia St
- 36727 Magnolia St
- 36751 Magnolia St
- 6828 George Ave
- 36757 Olive St