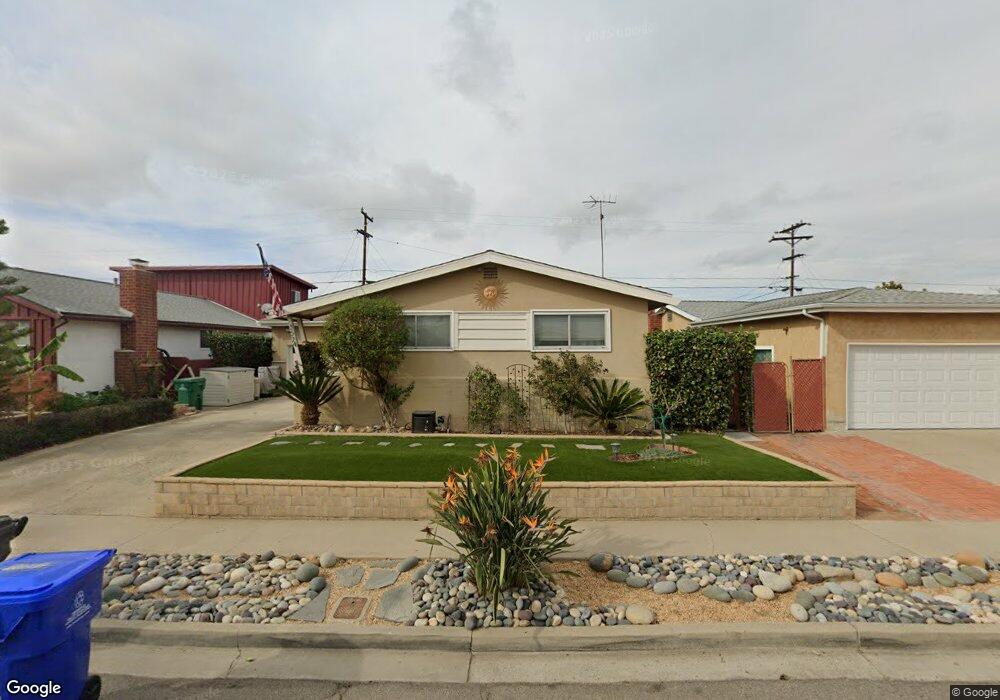
3674 Ben St San Diego, CA 92111
Clairemont Mesa East NeighborhoodEstimated Value: $1,058,000 - $1,099,345
3
Beds
2
Baths
1,516
Sq Ft
$713/Sq Ft
Est. Value
About This Home
This home is located at 3674 Ben St, San Diego, CA 92111 and is currently estimated at $1,081,336, approximately $713 per square foot. 3674 Ben St is a home located in San Diego County with nearby schools including Ross Elementary, Montgomery Middle School, and Kavod Charter School.
Ownership History
Date
Name
Owned For
Owner Type
Purchase Details
Closed on
May 25, 2016
Sold by
Carothers Donald E
Bought by
Cunningham Christopher G and Cunningham Patricia M
Current Estimated Value
Home Financials for this Owner
Home Financials are based on the most recent Mortgage that was taken out on this home.
Original Mortgage
$456,750
Outstanding Balance
$363,011
Interest Rate
3.61%
Mortgage Type
New Conventional
Estimated Equity
$718,325
Purchase Details
Closed on
Nov 22, 2006
Sold by
Carothers Edwin W and Carothers Linda J
Bought by
The Carothers Family Trust
Home Financials for this Owner
Home Financials are based on the most recent Mortgage that was taken out on this home.
Original Mortgage
$30,000
Interest Rate
6.37%
Mortgage Type
Credit Line Revolving
Purchase Details
Closed on
Dec 6, 1996
Sold by
Carothers Edwin W and Carothers Linda J
Bought by
The Carothers Family Trust
Create a Home Valuation Report for This Property
The Home Valuation Report is an in-depth analysis detailing your home's value as well as a comparison with similar homes in the area
Home Values in the Area
Average Home Value in this Area
Purchase History
| Date | Buyer | Sale Price | Title Company |
|---|---|---|---|
| Cunningham Christopher G | $507,500 | Fidelity National Title Co | |
| The Carothers Family Trust | -- | Lsi Title Co | |
| Carothers Edwin W | -- | Lsi Title Co | |
| The Carothers Family Trust | -- | -- |
Source: Public Records
Mortgage History
| Date | Status | Borrower | Loan Amount |
|---|---|---|---|
| Open | Cunningham Christopher G | $456,750 | |
| Previous Owner | Carothers Edwin W | $30,000 |
Source: Public Records
Tax History Compared to Growth
Tax History
| Year | Tax Paid | Tax Assessment Tax Assessment Total Assessment is a certain percentage of the fair market value that is determined by local assessors to be the total taxable value of land and additions on the property. | Land | Improvement |
|---|---|---|---|---|
| 2025 | $7,182 | $600,769 | $130,585 | $470,184 |
| 2024 | $7,182 | $588,990 | $128,025 | $460,965 |
| 2023 | $7,022 | $577,442 | $125,515 | $451,927 |
| 2022 | $6,834 | $566,120 | $123,054 | $443,066 |
| 2021 | $6,786 | $555,021 | $120,642 | $434,379 |
| 2020 | $6,703 | $549,330 | $119,405 | $429,925 |
| 2019 | $6,582 | $538,560 | $117,064 | $421,496 |
| 2018 | $6,152 | $528,001 | $114,769 | $413,232 |
| 2017 | $6,004 | $517,649 | $112,519 | $405,130 |
| 2016 | $914 | $75,311 | $16,370 | $58,941 |
| 2015 | $901 | $74,181 | $16,125 | $58,056 |
| 2014 | $888 | $72,729 | $15,810 | $56,919 |
Source: Public Records
Map
Nearby Homes
- 7131 Malta St
- 3484 Armstrong St
- 7441 Beagle St
- 7273 Arillo St
- 7265 Arillo St
- 3516 Atoll St
- 7029 Hilton Place
- 3781 Ashford St
- 3373 Armstrong St
- 3758 Antiem St
- 7045 Beagle St
- 7414 Ashford Place
- 3662 Marlesta Dr
- 3654 Marlesta Dr
- 3735 Budd St
- 7661 Stalmer St
- 8036 Linda Vista Rd Unit 2
- 8036 Linda Vista Rd Unit 1F
- 8036 Linda Vista Rd Unit 2P
- 7797 Stalmer St Unit 1F