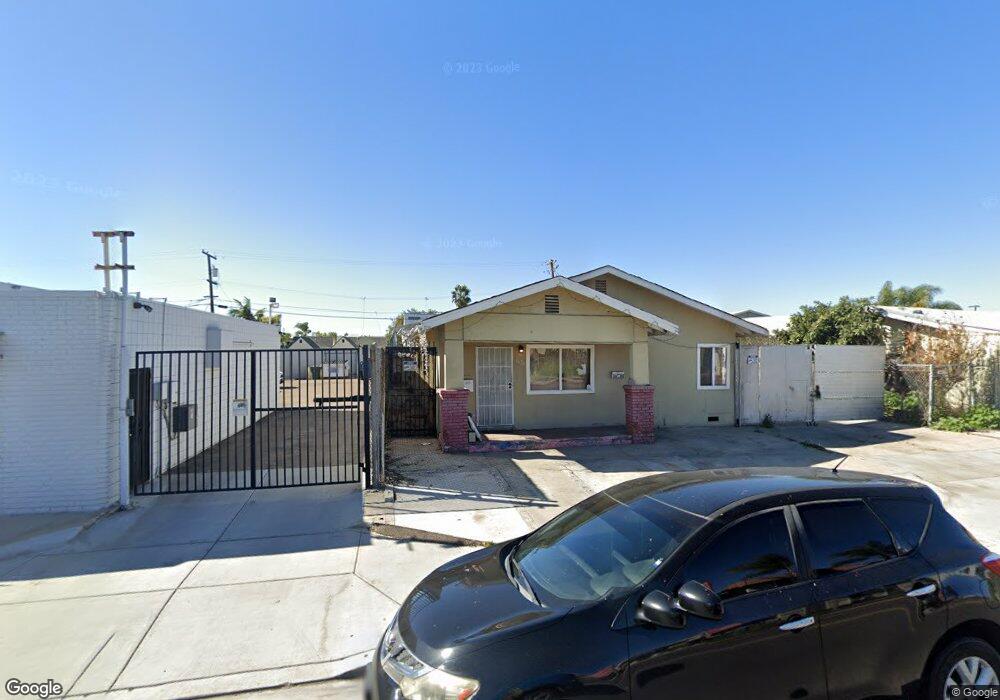
3676 Fairmount Ave San Diego, CA 92105
Castle NeighborhoodEstimated Value: $661,000 - $1,227,000
5
Beds
2
Baths
3,000
Sq Ft
$291/Sq Ft
Est. Value
About This Home
This home is located at 3676 Fairmount Ave, San Diego, CA 92105 and is currently estimated at $871,689, approximately $290 per square foot. 3676 Fairmount Ave is a home located in San Diego County with nearby schools including Joyner Elementary School, Clark Middle School, and Herbert Hoover High School.
Ownership History
Date
Name
Owned For
Owner Type
Purchase Details
Closed on
Dec 8, 2022
Sold by
Maple Holding Company Llc
Bought by
Status Investments Inc
Current Estimated Value
Home Financials for this Owner
Home Financials are based on the most recent Mortgage that was taken out on this home.
Original Mortgage
$910,000
Interest Rate
7.08%
Mortgage Type
New Conventional
Purchase Details
Closed on
Jan 28, 2022
Sold by
Pham Family Trust
Bought by
Maple Holding Company Llc
Home Financials for this Owner
Home Financials are based on the most recent Mortgage that was taken out on this home.
Original Mortgage
$567,500
Interest Rate
3.55%
Mortgage Type
Construction
Purchase Details
Closed on
Jul 28, 2005
Sold by
Pham Thu N and Ngo Thu L
Bought by
Pham Thu N and Ngo Thu L
Purchase Details
Closed on
Feb 6, 1992
Create a Home Valuation Report for This Property
The Home Valuation Report is an in-depth analysis detailing your home's value as well as a comparison with similar homes in the area
Home Values in the Area
Average Home Value in this Area
Purchase History
| Date | Buyer | Sale Price | Title Company |
|---|---|---|---|
| Status Investments Inc | $1,300,000 | Ticor Title | |
| Maple Holding Company Llc | $550,000 | Ticor Title | |
| Pham Thu N | -- | -- | |
| -- | $145,000 | -- |
Source: Public Records
Mortgage History
| Date | Status | Borrower | Loan Amount |
|---|---|---|---|
| Closed | Status Investments Inc | $910,000 | |
| Previous Owner | Maple Holding Company Llc | $567,500 |
Source: Public Records
Tax History Compared to Growth
Tax History
| Year | Tax Paid | Tax Assessment Tax Assessment Total Assessment is a certain percentage of the fair market value that is determined by local assessors to be the total taxable value of land and additions on the property. | Land | Improvement |
|---|---|---|---|---|
| 2025 | $8,717 | $655,452 | $520,200 | $135,252 |
| 2024 | $8,717 | $642,600 | $510,000 | $132,600 |
| 2023 | $8,492 | $630,000 | $500,000 | $130,000 |
| 2022 | $3,649 | $241,586 | $137,977 | $103,609 |
| 2021 | $3,577 | $236,850 | $135,272 | $101,578 |
| 2020 | $3,519 | $234,422 | $133,885 | $100,537 |
| 2019 | $3,467 | $229,826 | $131,260 | $98,566 |
| 2018 | $3,282 | $225,321 | $128,687 | $96,634 |
| 2017 | $3,218 | $220,904 | $126,164 | $94,740 |
| 2016 | $3,176 | $216,574 | $123,691 | $92,883 |
| 2015 | $3,110 | $213,322 | $121,834 | $91,488 |
| 2014 | $3,071 | $209,144 | $119,448 | $89,696 |
Source: Public Records
Map
Nearby Homes
- 3655 44th St
- 3571 Highland Ave
- 3565 Highland Ave Unit 5
- 3825 Van Dyke Ave
- 4600 Myrtle Ave
- 3815 42nd St
- 3833-39 N 42nd St
- 3578 Chamoune Ave
- 3863 Highland Ave Unit 4
- 3733 Chamoune Ave
- 3450 42nd St
- 4025 Van Dyke Ave
- 4055 Van Dyke Ave
- 3842 46th St
- 3215 44th St Unit 17
- 0 Highland Ave Unit PTP2503410
- 0 42nd Unit PTP2505266
- 3222 42nd St
- 4128 Thorn St
- 4146 Fairmount Ave
- 3676 Fairmount Ave Unit 29
- 3684 Fairmount Ave
- 3684 3684 Fairmount Ave
- 4333 Landis St
- 4341 Landis St
- 4327 Landis St
- 3677 43rd St Unit 7
- 3677 43rd St Unit 6
- 3677 43rd St Unit 5
- 3677 43rd St Unit 4
- 3677 43rd St Unit 3
- 3677 43rd St Unit 2
- 3677 43rd St Unit 1
- 3689 43rd St Unit 91
- 3685 43rd St
- 3679 Fairmount Ave
- 3661 43rd St Unit 7
- 3661 43rd St Unit 6
- 3661 43rd St Unit 5
- 3661 43rd St Unit 4