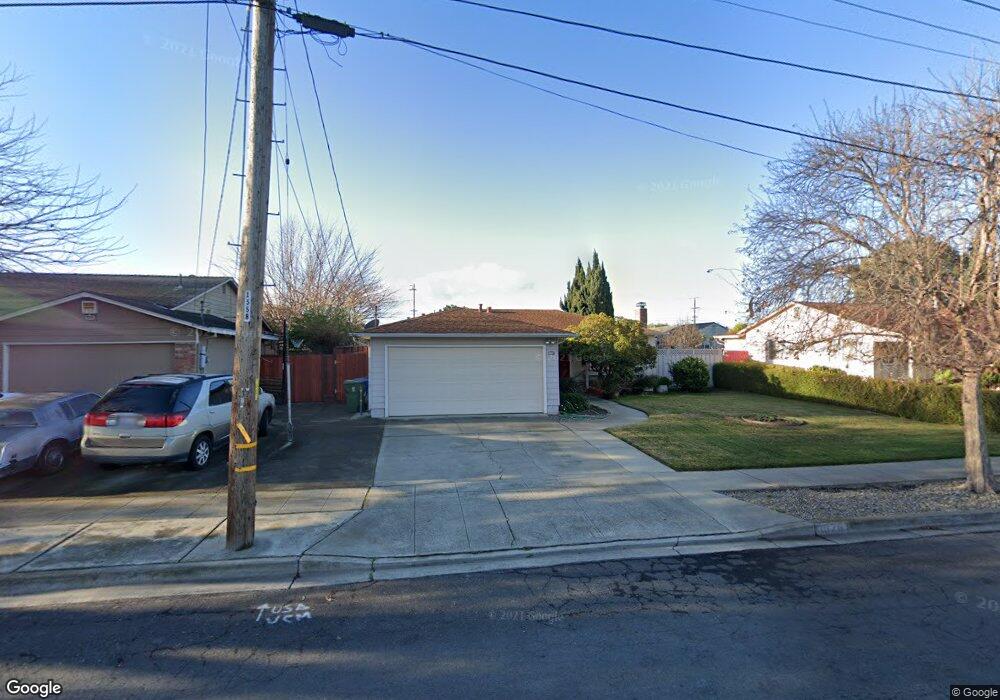
36761 Ada Ave Fremont, CA 94536
Estimated Value: $1,384,000 - $1,576,000
4
Beds
2
Baths
1,473
Sq Ft
$986/Sq Ft
Est. Value
About This Home
This home is located at 36761 Ada Ave, Fremont, CA 94536 and is currently estimated at $1,452,409, approximately $986 per square foot. 36761 Ada Ave is a home located in Alameda County with nearby schools including Cabrillo Elementary School, Centerville Junior High School, and Washington High School.
Ownership History
Date
Name
Owned For
Owner Type
Purchase Details
Closed on
Dec 11, 2020
Sold by
Sinha Manoj and Palia Parizad J
Bought by
Palia Parizad J and Sinha Manoj
Current Estimated Value
Purchase Details
Closed on
Jun 6, 2005
Sold by
Hoover Ethen E and Lockett Cynthia
Bought by
Sinha Manoj and Palia Parizad J
Home Financials for this Owner
Home Financials are based on the most recent Mortgage that was taken out on this home.
Original Mortgage
$520,000
Outstanding Balance
$264,625
Interest Rate
5.37%
Mortgage Type
Purchase Money Mortgage
Estimated Equity
$1,187,784
Purchase Details
Closed on
Apr 25, 2002
Sold by
Hudson Marjorie V and Hudson Family Trust
Bought by
Hoover Ethen E and Lockett Cynthia
Home Financials for this Owner
Home Financials are based on the most recent Mortgage that was taken out on this home.
Original Mortgage
$337,125
Interest Rate
7.72%
Create a Home Valuation Report for This Property
The Home Valuation Report is an in-depth analysis detailing your home's value as well as a comparison with similar homes in the area
Home Values in the Area
Average Home Value in this Area
Purchase History
| Date | Buyer | Sale Price | Title Company |
|---|---|---|---|
| Palia Parizad J | -- | None Available | |
| Sinha Manoj | $650,000 | -- | |
| Hoover Ethen E | $375,000 | North American Title Co |
Source: Public Records
Mortgage History
| Date | Status | Borrower | Loan Amount |
|---|---|---|---|
| Open | Sinha Manoj | $520,000 | |
| Previous Owner | Hoover Ethen E | $337,125 |
Source: Public Records
Tax History Compared to Growth
Tax History
| Year | Tax Paid | Tax Assessment Tax Assessment Total Assessment is a certain percentage of the fair market value that is determined by local assessors to be the total taxable value of land and additions on the property. | Land | Improvement |
|---|---|---|---|---|
| 2025 | $10,853 | $903,444 | $271,787 | $638,657 |
| 2024 | $10,853 | $885,598 | $266,459 | $626,139 |
| 2023 | $10,514 | $870,784 | $261,235 | $609,549 |
| 2022 | $10,380 | $846,715 | $256,114 | $597,601 |
| 2021 | $10,124 | $829,978 | $251,093 | $585,885 |
| 2020 | $10,159 | $828,398 | $248,519 | $579,879 |
| 2019 | $10,042 | $812,161 | $243,648 | $568,513 |
| 2018 | $9,846 | $796,243 | $238,873 | $557,370 |
| 2017 | $9,599 | $780,636 | $234,191 | $546,445 |
| 2016 | $9,437 | $765,335 | $229,600 | $535,735 |
| 2015 | $8,328 | $670,000 | $201,000 | $469,000 |
| 2014 | $7,808 | $625,000 | $187,500 | $437,500 |
Source: Public Records
Map
Nearby Homes
- 4632 Balboa Way
- 36521 Cabrillo Dr
- 4543 Bartolo Terrace
- 4412 Elaiso Common
- 4544 Thornton Ave
- 37001 Contra Costa Ave
- 36347 Magellan Dr
- 36304 Magellan Dr
- 4637 Rothbury Common
- 37114 Dondero Way
- 36139 San Pedro Dr
- 36686 Charles St
- 36720 Charles St
- 36202 Worthing Dr
- 36288 Saxon Ct
- 35978 Magellan Dr
- 35942 Adobe Dr
- 4955 Swindon Place
- 35936 Magellan Dr
- 4626 Alhambra Dr
- 36753 Ada Ave
- 36769 Ada Ave
- 36762 Cabrillo Dr
- 4713 Balboa Way
- 36750 Cabrillo Dr
- 36745 Ada Ave
- 4659 Balboa Way
- 36738 Cabrillo Dr
- 36754 Ada Ave
- 36746 Ada Ave
- 4686 Balboa Way
- 36737 Ada Ave
- 4680 Balboa Way
- 4674 Balboa Way
- 36726 Cabrillo Dr
- 4714 Balboa Way
- 4651 Balboa Way
- 36738 Ada Ave
- 4656 Balboa Way
- 36660 Cabrillo Dr