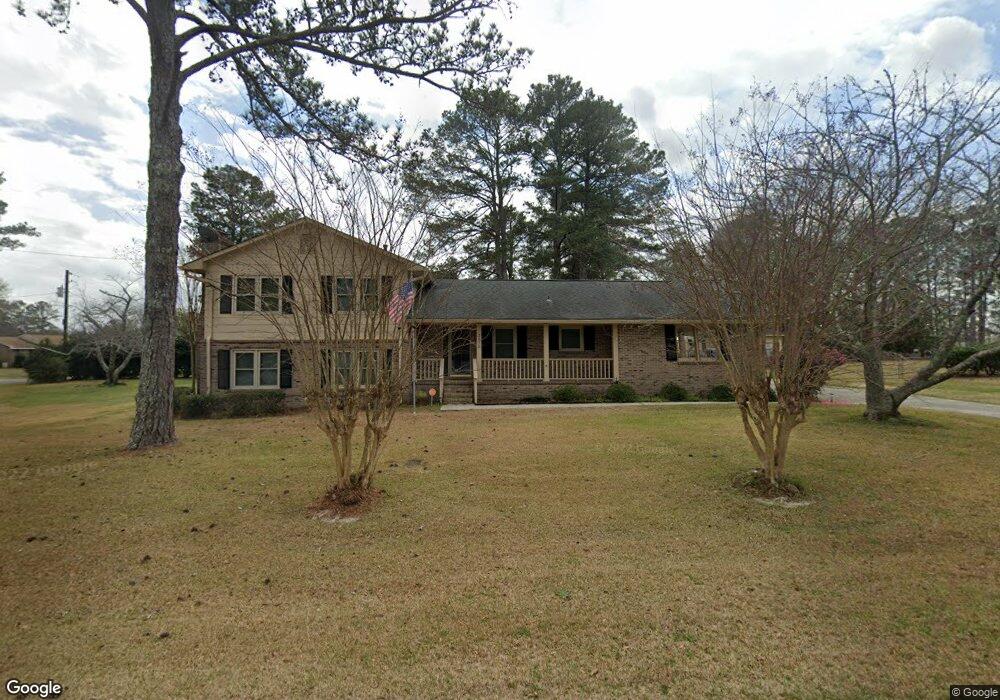
3678 Kay Dr Macon, GA 31216
Estimated Value: $203,508 - $302,000
4
Beds
3
Baths
1,562
Sq Ft
$149/Sq Ft
Est. Value
About This Home
This home is located at 3678 Kay Dr, Macon, GA 31216 and is currently estimated at $233,377, approximately $149 per square foot. 3678 Kay Dr is a home located in Bibb County with nearby schools including Heard Elementary School, Rutland Middle School, and Rutland High School.
Ownership History
Date
Name
Owned For
Owner Type
Purchase Details
Closed on
Jan 9, 2019
Sold by
Kendrick Kimberly Elaine
Bought by
Kendrick Kimberly Elaine and Kendrick Richie Vernell
Current Estimated Value
Purchase Details
Closed on
Dec 17, 2010
Sold by
Kendrick Richie Vernell
Bought by
Kendrick Kimberly E
Home Financials for this Owner
Home Financials are based on the most recent Mortgage that was taken out on this home.
Original Mortgage
$125,543
Outstanding Balance
$1,817
Interest Rate
3.75%
Mortgage Type
FHA
Estimated Equity
$231,560
Purchase Details
Closed on
Oct 3, 2003
Bought by
Kendrick Kimberly and Kendrick Richie V
Purchase Details
Closed on
Jul 14, 2003
Create a Home Valuation Report for This Property
The Home Valuation Report is an in-depth analysis detailing your home's value as well as a comparison with similar homes in the area
Purchase History
| Date | Buyer | Sale Price | Title Company |
|---|---|---|---|
| Kendrick Kimberly Elaine | -- | None Available | |
| Kendrick Kimberly E | -- | None Available | |
| Kendrick Kimberly | -- | -- | |
| -- | $140,000 | -- |
Source: Public Records
Mortgage History
| Date | Status | Borrower | Loan Amount |
|---|---|---|---|
| Open | Kendrick Kimberly E | $125,543 |
Source: Public Records
Tax History Compared to Growth
Tax History
| Year | Tax Paid | Tax Assessment Tax Assessment Total Assessment is a certain percentage of the fair market value that is determined by local assessors to be the total taxable value of land and additions on the property. | Land | Improvement |
|---|---|---|---|---|
| 2025 | $1,341 | $61,572 | $9,660 | $51,912 |
| 2024 | $1,386 | $61,572 | $9,660 | $51,912 |
| 2023 | $1,616 | $61,572 | $9,660 | $51,912 |
| 2022 | $1,739 | $57,240 | $8,760 | $48,480 |
| 2021 | $1,909 | $57,240 | $8,760 | $48,480 |
| 2020 | $1,951 | $57,240 | $8,760 | $48,480 |
| 2019 | $1,900 | $55,544 | $8,760 | $46,784 |
| 2018 | $2,912 | $52,578 | $8,760 | $43,818 |
| 2017 | $1,708 | $52,578 | $8,760 | $43,818 |
| 2016 | $1,632 | $54,162 | $10,512 | $43,649 |
| 2015 | $2,310 | $54,162 | $10,512 | $43,649 |
| 2014 | $2,314 | $54,162 | $10,512 | $43,649 |
Source: Public Records
Map
Nearby Homes
- 3655 Kay Dr
- 4011 Springhead Way
- 4011 Springhead Way Unit LOT 97
- 6670 Fran Dr
- 3676 Jones Rd
- 405 Stonecrest Ct
- 0 Houston Rd Unit 10572705
- 3720 Dean Dr
- 813 Ocala National Trail
- 361 Thoroughbred Ln
- 00 Houston Rd
- 215 Stonefield Cir
- 308 Ellis Ct
- 6045 Cara Dr
- 5741 Lawrence Ct
- 3491 Sandy Cir
- 6530 Bevin Dr
- 5731 School Rd
- 201 Liberty Trace
- 5608 Swymer Dr