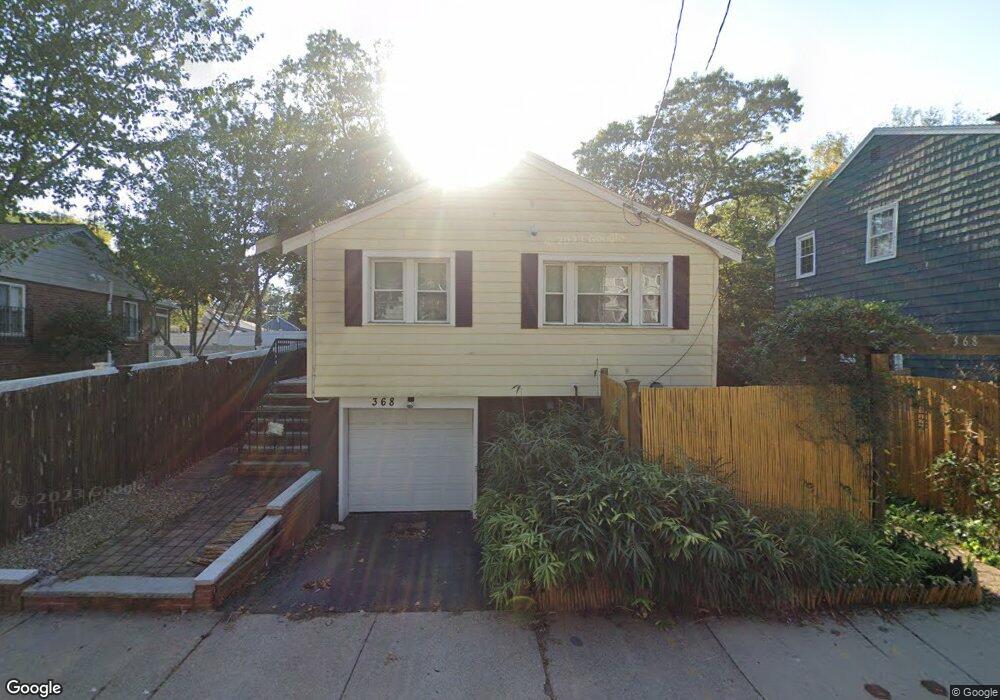
368 Corey St West Roxbury, MA 02132
West Roxbury NeighborhoodEstimated Value: $732,298 - $824,000
3
Beds
2
Baths
1,104
Sq Ft
$716/Sq Ft
Est. Value
About This Home
This home is located at 368 Corey St, West Roxbury, MA 02132 and is currently estimated at $790,575, approximately $716 per square foot. 368 Corey St is a home located in Suffolk County with nearby schools including Holy Name Parish School, St Theresa School, and Catholic Memorial School.
Ownership History
Date
Name
Owned For
Owner Type
Purchase Details
Closed on
Nov 29, 2019
Sold by
Song Yi
Bought by
Onepoint Real Estate Corp
Current Estimated Value
Purchase Details
Closed on
Aug 28, 2009
Sold by
Spinney Paul B
Bought by
Song Yi
Home Financials for this Owner
Home Financials are based on the most recent Mortgage that was taken out on this home.
Original Mortgage
$312,000
Interest Rate
5.17%
Mortgage Type
Purchase Money Mortgage
Create a Home Valuation Report for This Property
The Home Valuation Report is an in-depth analysis detailing your home's value as well as a comparison with similar homes in the area
Home Values in the Area
Average Home Value in this Area
Purchase History
| Date | Buyer | Sale Price | Title Company |
|---|---|---|---|
| Onepoint Real Estate Corp | -- | None Available | |
| Song Yi | $390,000 | -- |
Source: Public Records
Mortgage History
| Date | Status | Borrower | Loan Amount |
|---|---|---|---|
| Previous Owner | Song Yi | $312,000 |
Source: Public Records
Tax History Compared to Growth
Tax History
| Year | Tax Paid | Tax Assessment Tax Assessment Total Assessment is a certain percentage of the fair market value that is determined by local assessors to be the total taxable value of land and additions on the property. | Land | Improvement |
|---|---|---|---|---|
| 2025 | $7,262 | $627,100 | $197,200 | $429,900 |
| 2024 | $6,883 | $631,500 | $206,000 | $425,500 |
| 2023 | $6,583 | $612,900 | $199,900 | $413,000 |
| 2022 | $6,063 | $557,300 | $181,800 | $375,500 |
| 2021 | $5,545 | $519,700 | $173,100 | $346,600 |
| 2020 | $4,883 | $462,400 | $161,300 | $301,100 |
| 2019 | $4,683 | $444,300 | $130,200 | $314,100 |
| 2018 | $4,313 | $411,500 | $130,200 | $281,300 |
| 2017 | $4,125 | $389,500 | $130,200 | $259,300 |
| 2016 | $3,967 | $360,600 | $130,200 | $230,400 |
| 2015 | $4,366 | $360,500 | $140,300 | $220,200 |
| 2014 | $4,278 | $340,100 | $140,300 | $199,800 |
Source: Public Records
Map
Nearby Homes
- 701 Vfw Pkwy
- 845 Lagrange St Unit 4
- 865 Lagrange St Unit 5
- 139 Newfield St
- 931 Lagrange St
- 89 Dwinell St
- 76 Vermont St
- 168 Maple St
- 23 Westgate Rd Unit 6
- 37 Pomfret St
- 1307 Lagrange St Unit 1307
- 42 Bryon Rd Unit 6
- 21 Westgate Rd Unit 6
- 579 Baker St Unit 579
- 577 Baker St Unit 577
- 64 Bryon Rd Unit 1
- 9 Carroll St
- 331 Vermont St
- 539 Lagrange St
- 76 Potomac St