368 E 400 S Valparaiso, IN 46383
Porter County NeighborhoodEstimated Value: $467,000 - $637,000
6
Beds
3
Baths
3,886
Sq Ft
$142/Sq Ft
Est. Value
About This Home
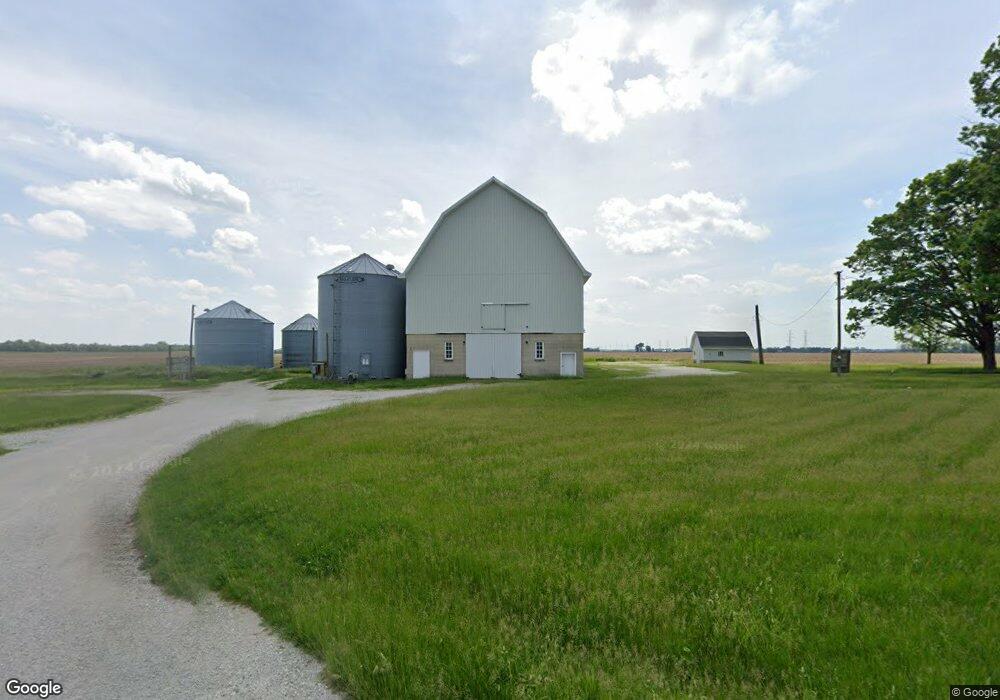
This home is located at 368 E 400 S, Valparaiso, IN 46383 and is currently estimated at $550,437, approximately $141 per square foot. 368 E 400 S is a home located in Porter County with nearby schools including Morgan Township Elementary School and Morgan Township Middle/High School.
Ownership History
Date
Name
Owned For
Owner Type
Purchase Details
Closed on
Jan 3, 2011
Sold by
Remster Emily and Remster Emily A
Bought by
Emily Ann Remster Trust #7
Current Estimated Value
Purchase Details
Closed on
Jul 26, 2010
Sold by
Remster Emily Ann and John Remster Sr Trust
Bought by
Remster Emily Ann and Trust #7
Purchase Details
Closed on
Nov 30, 2005
Sold by
Remster John
Bought by
Remster John M and Remster Emily Ann
Create a Home Valuation Report for This Property
The Home Valuation Report is an in-depth analysis detailing your home's value as well as a comparison with similar homes in the area
Home Values in the Area
Average Home Value in this Area
Purchase History
| Date | Buyer | Sale Price | Title Company |
|---|---|---|---|
| Emily Ann Remster Trust #7 | -- | None Available | |
| Remster Emily Ann | -- | None Available | |
| Remster John M | -- | -- |
Source: Public Records
Tax History Compared to Growth
Tax History
| Year | Tax Paid | Tax Assessment Tax Assessment Total Assessment is a certain percentage of the fair market value that is determined by local assessors to be the total taxable value of land and additions on the property. | Land | Improvement |
|---|---|---|---|---|
| 2024 | $4,430 | $536,400 | $83,900 | $452,500 |
| 2023 | $4,935 | $368,300 | $270,800 | $97,500 |
| 2022 | $4,078 | $446,600 | $72,500 | $374,100 |
| 2021 | $5,143 | $416,100 | $72,000 | $344,100 |
| 2020 | $5,128 | $374,700 | $63,000 | $311,700 |
| 2019 | $6,042 | $325,100 | $63,600 | $261,500 |
| 2018 | $5,955 | $322,800 | $63,700 | $259,100 |
| 2017 | $6,455 | $322,500 | $64,300 | $258,200 |
| 2016 | $6,291 | $305,800 | $65,900 | $239,900 |
| 2014 | $2,930 | $296,900 | $64,100 | $232,800 |
| 2013 | -- | $284,900 | $64,100 | $220,800 |
Source: Public Records
Map
Nearby Homes