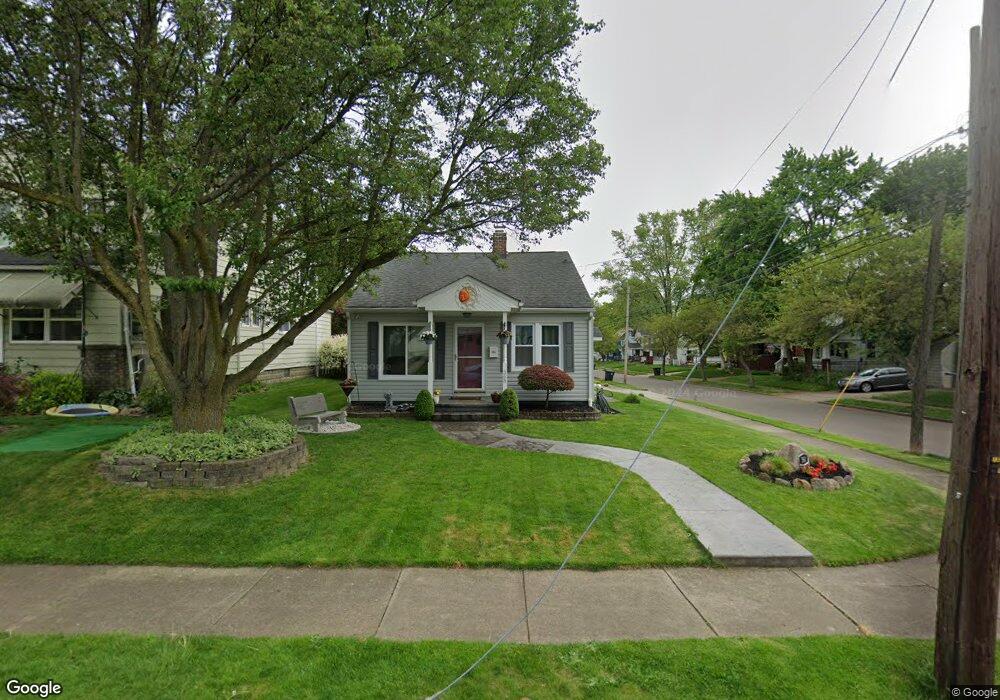
368 E York St Akron, OH 44310
North Hill NeighborhoodEstimated Value: $82,000 - $105,000
2
Beds
1
Bath
816
Sq Ft
$111/Sq Ft
Est. Value
About This Home
This home is located at 368 E York St, Akron, OH 44310 and is currently estimated at $90,953, approximately $111 per square foot. 368 E York St is a home located in Summit County with nearby schools including North High School, Edge Academy, The, and Akros Middle School.
Ownership History
Date
Name
Owned For
Owner Type
Purchase Details
Closed on
Dec 7, 2023
Sold by
Herbert James H and Herbert Lorraine K
Bought by
Fronter Michael
Current Estimated Value
Purchase Details
Closed on
Nov 17, 2004
Sold by
Jp Morgan Chase Bank
Bought by
Herbert James H and Herbert Lorraine K
Home Financials for this Owner
Home Financials are based on the most recent Mortgage that was taken out on this home.
Original Mortgage
$40,400
Interest Rate
5.91%
Mortgage Type
Purchase Money Mortgage
Purchase Details
Closed on
Jul 15, 2004
Sold by
Wiland Jeffrey P
Bought by
Jp Morgan Chase Bank and Texas Commerce Bank Na
Purchase Details
Closed on
Aug 20, 1999
Sold by
Calvaruso Paul
Bought by
Wiland Jeffrey P
Home Financials for this Owner
Home Financials are based on the most recent Mortgage that was taken out on this home.
Original Mortgage
$35,000
Interest Rate
7.7%
Mortgage Type
Balloon
Create a Home Valuation Report for This Property
The Home Valuation Report is an in-depth analysis detailing your home's value as well as a comparison with similar homes in the area
Home Values in the Area
Average Home Value in this Area
Purchase History
We collect this data history from publicly available records. To have your information removed, we recommend requesting removal directly through your county’s website.
| Date | Buyer | Sale Price | Title Company |
|---|---|---|---|
| Fronter Michael | $68,100 | None Listed On Document | |
| Herbert James H | $44,900 | American Certified Title | |
| Jp Morgan Chase Bank | $48,000 | -- | |
| Wiland Jeffrey P | $60,000 | Colonial Title Agency Inc |
Source: Public Records
Mortgage History
We collect this data history from publicly available records. To have your information removed, we recommend requesting removal directly through your county’s website.
| Date | Status | Borrower | Loan Amount |
|---|---|---|---|
| Previous Owner | Herbert James H | $40,400 | |
| Previous Owner | Wiland Jeffrey P | $35,000 |
Source: Public Records
Tax History
| Year | Tax Paid | Tax Assessment Tax Assessment Total Assessment is a certain percentage of the fair market value that is determined by local assessors to be the total taxable value of land and additions on the property. | Land | Improvement |
|---|---|---|---|---|
| 2025 | $1,545 | $23,828 | $6,713 | $17,115 |
| 2024 | $1,545 | $23,828 | $6,713 | $17,115 |
| 2023 | $1,545 | $23,828 | $6,713 | $17,115 |
| 2022 | $1,616 | $18,306 | $4,974 | $13,332 |
| 2021 | $1,517 | $18,306 | $4,974 | $13,332 |
| 2020 | $1,599 | $18,300 | $4,970 | $13,330 |
| 2019 | $1,603 | $18,000 | $4,730 | $13,270 |
| 2018 | $1,425 | $15,540 | $4,730 | $10,810 |
| 2017 | $1,444 | $16,450 | $4,730 | $11,720 |
| 2016 | $1,445 | $16,450 | $4,730 | $11,720 |
| 2015 | $1,444 | $16,450 | $4,730 | $11,720 |
| 2014 | $1,434 | $16,450 | $4,730 | $11,720 |
| 2013 | $1,658 | $18,940 | $4,730 | $14,210 |
Source: Public Records
Map
Nearby Homes
- 372 E York St
- 509 Patterson Ave
- 378 E York St
- 358 E York St
- 505 Patterson Ave
- 382 E York St
- 354 E York St
- 508 Patterson Ave
- 367 E York St
- 508 Oxford Ave
- 373 E York St Unit 375
- 504 Patterson Ave
- 386 E York St
- 500 Patterson Ave
- 348 E York St Unit 350
- 377 E York St
- 359 E York St
- 504 Oxford Ave
- 499 Patterson Ave
- 383 E York St
Your Personal Tour Guide
Ask me questions while you tour the home.