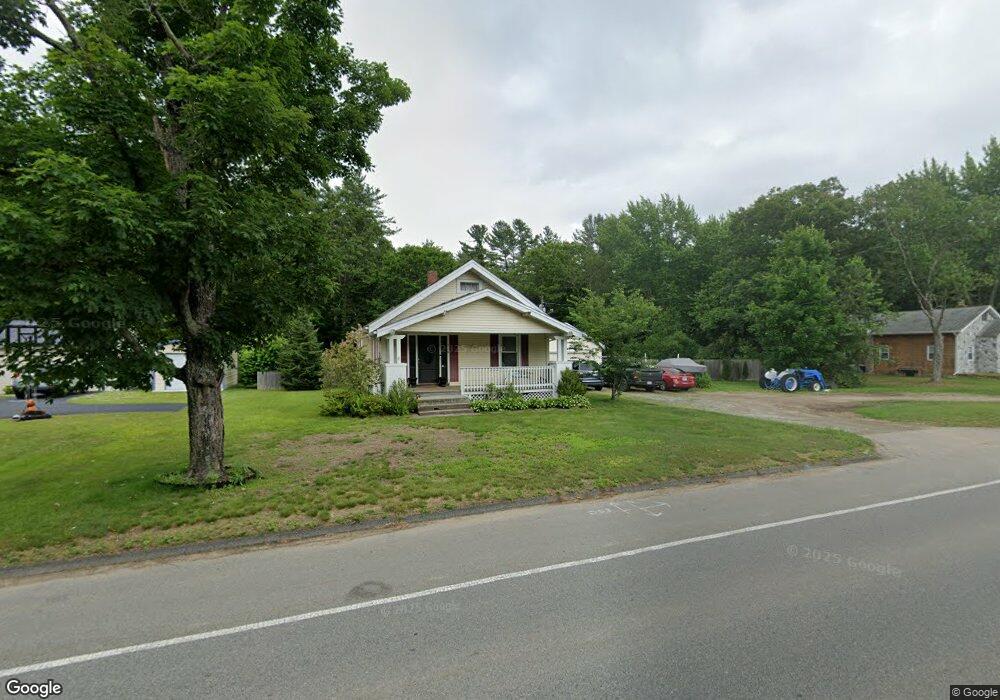
368 Elm St Mansfield, MA 02048
Estimated Value: $533,000 - $798,000
3
Beds
3
Baths
1,220
Sq Ft
$501/Sq Ft
Est. Value
About This Home
This home is located at 368 Elm St, Mansfield, MA 02048 and is currently estimated at $611,746, approximately $501 per square foot. 368 Elm St is a home located in Bristol County with nearby schools including Everett W. Robinson Elementary School, Jordan/Jackson Elementary School, and Harold L. Qualters Middle School.
Ownership History
Date
Name
Owned For
Owner Type
Purchase Details
Closed on
Jan 4, 2013
Sold by
Fournier James A and Fournier Laura M
Bought by
Mcnamara 3Rd Joseph H and Mcnamara Jaclyn
Current Estimated Value
Home Financials for this Owner
Home Financials are based on the most recent Mortgage that was taken out on this home.
Original Mortgage
$284,747
Outstanding Balance
$197,800
Interest Rate
3.35%
Mortgage Type
New Conventional
Estimated Equity
$413,946
Purchase Details
Closed on
Aug 31, 1994
Sold by
Spiller Christina and Lagerstedt Christine
Bought by
Warnick Laura M
Home Financials for this Owner
Home Financials are based on the most recent Mortgage that was taken out on this home.
Original Mortgage
$40,000
Interest Rate
8.44%
Mortgage Type
Purchase Money Mortgage
Create a Home Valuation Report for This Property
The Home Valuation Report is an in-depth analysis detailing your home's value as well as a comparison with similar homes in the area
Home Values in the Area
Average Home Value in this Area
Purchase History
| Date | Buyer | Sale Price | Title Company |
|---|---|---|---|
| Mcnamara 3Rd Joseph H | $290,000 | -- | |
| Warnick Laura M | $148,500 | -- |
Source: Public Records
Mortgage History
| Date | Status | Borrower | Loan Amount |
|---|---|---|---|
| Open | Warnick Laura M | $284,747 | |
| Previous Owner | Warnick Laura M | $37,800 | |
| Previous Owner | Warnick Laura M | $40,000 | |
| Previous Owner | Warnick Laura M | $95,200 |
Source: Public Records
Tax History
| Year | Tax Paid | Tax Assessment Tax Assessment Total Assessment is a certain percentage of the fair market value that is determined by local assessors to be the total taxable value of land and additions on the property. | Land | Improvement |
|---|---|---|---|---|
| 2025 | $5,720 | $434,300 | $262,300 | $172,000 |
| 2024 | $5,855 | $433,700 | $262,300 | $171,400 |
| 2023 | $5,798 | $411,500 | $262,300 | $149,200 |
| 2022 | $5,666 | $373,500 | $243,600 | $129,900 |
| 2021 | $3,262 | $358,200 | $212,600 | $145,600 |
| 2020 | $5,239 | $341,100 | $202,800 | $138,300 |
| 2019 | $4,446 | $292,100 | $170,100 | $122,000 |
| 2018 | $0 | $284,700 | $162,700 | $122,000 |
| 2017 | $4,121 | $274,400 | $158,400 | $116,000 |
| 2016 | $3,976 | $258,000 | $150,900 | $107,100 |
| 2015 | $3,839 | $247,700 | $150,900 | $96,800 |
Source: Public Records
Map
Nearby Homes
- 2 Oak St Unit 2B
- 14 Claire Ave
- 451R Gilbert St
- 150 Gilbert St
- 71 Richardson Ave
- 250 Mansfield Ave Unit 11
- 143 Oak St Unit 10
- 343 Godfrey Dr
- 49 Pheasant Hill Rd
- 128 Tremont St
- 10 Walter St
- 157 Mansfield Ave Unit 27
- 157 Mansfield Ave Unit 14
- 24 Maverick Dr
- 345 Richardson Ave
- 20 John F. Kennedy Dr
- 4 Village Way Unit F
- 1769 West St
- 19 Barberry Rd
- 16 Holly Rd
Your Personal Tour Guide
Ask me questions while you tour the home.