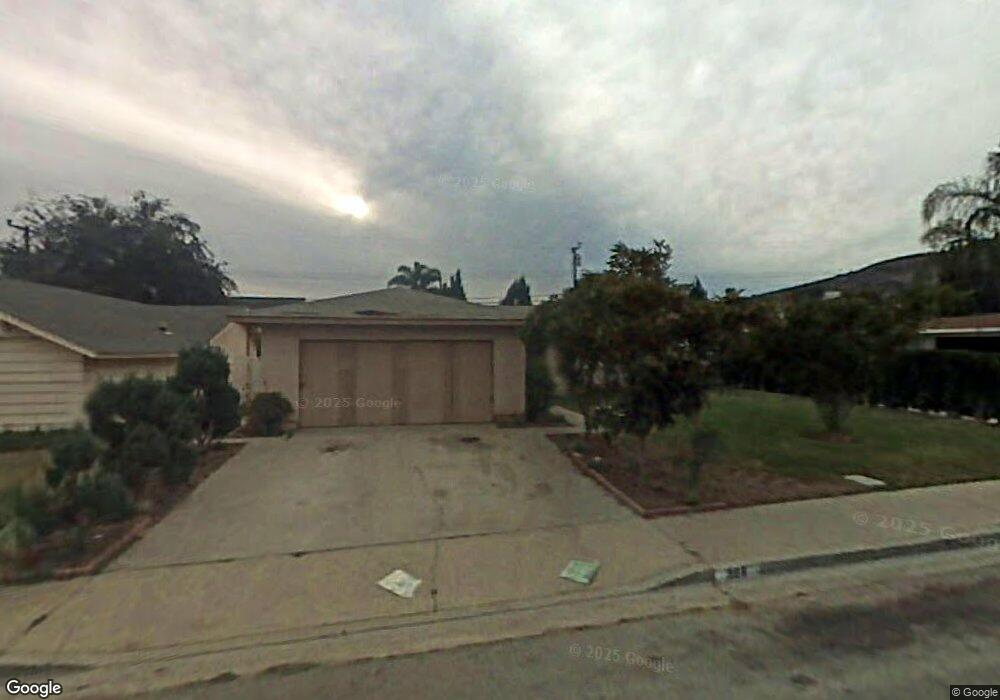
368 Hardison St Santa Paula, CA 93060
Estimated Value: $643,420 - $796,000
3
Beds
2
Baths
1,144
Sq Ft
$618/Sq Ft
Est. Value
About This Home
This home is located at 368 Hardison St, Santa Paula, CA 93060 and is currently estimated at $707,355, approximately $618 per square foot. 368 Hardison St is a home located in Ventura County with nearby schools including Blanchard Elementary School, Isbell Middle, and Santa Paula High.
Ownership History
Date
Name
Owned For
Owner Type
Purchase Details
Closed on
Jul 12, 2002
Sold by
Gallegos Saul V and Aguilar Alberto
Bought by
Aguilar Margarito
Current Estimated Value
Home Financials for this Owner
Home Financials are based on the most recent Mortgage that was taken out on this home.
Original Mortgage
$182,000
Outstanding Balance
$76,551
Interest Rate
6.6%
Estimated Equity
$630,804
Purchase Details
Closed on
May 13, 1994
Sold by
Lazaro Teresa Aspera
Bought by
Gallegos Saul
Home Financials for this Owner
Home Financials are based on the most recent Mortgage that was taken out on this home.
Original Mortgage
$145,501
Interest Rate
8.6%
Mortgage Type
FHA
Purchase Details
Closed on
May 3, 1994
Sold by
Aguilar Teresa
Bought by
Aguilar Margarito
Home Financials for this Owner
Home Financials are based on the most recent Mortgage that was taken out on this home.
Original Mortgage
$145,501
Interest Rate
8.6%
Mortgage Type
FHA
Create a Home Valuation Report for This Property
The Home Valuation Report is an in-depth analysis detailing your home's value as well as a comparison with similar homes in the area
Home Values in the Area
Average Home Value in this Area
Purchase History
| Date | Buyer | Sale Price | Title Company |
|---|---|---|---|
| Aguilar Margarito | $111,000 | First Southwestern Title Co | |
| Gallegos Saul | -- | First American Title Ins Co | |
| Aguilar Margarito | -- | First American Title Ins Co | |
| Gallegos Saul | $148,000 | First American Title Ins Co |
Source: Public Records
Mortgage History
| Date | Status | Borrower | Loan Amount |
|---|---|---|---|
| Open | Aguilar Margarito | $182,000 | |
| Previous Owner | Gallegos Saul | $145,501 |
Source: Public Records
Tax History Compared to Growth
Tax History
| Year | Tax Paid | Tax Assessment Tax Assessment Total Assessment is a certain percentage of the fair market value that is determined by local assessors to be the total taxable value of land and additions on the property. | Land | Improvement |
|---|---|---|---|---|
| 2025 | $4,046 | $358,441 | $142,456 | $215,985 |
| 2024 | $4,046 | $351,413 | $139,663 | $211,750 |
| 2023 | $3,960 | $344,523 | $136,924 | $207,599 |
| 2022 | $3,844 | $337,768 | $134,239 | $203,529 |
| 2021 | $3,832 | $331,146 | $131,607 | $199,539 |
| 2020 | $3,813 | $327,752 | $130,258 | $197,494 |
| 2019 | $3,619 | $321,326 | $127,704 | $193,622 |
| 2018 | $3,635 | $315,026 | $125,200 | $189,826 |
| 2017 | $3,677 | $308,850 | $122,746 | $186,104 |
| 2016 | $3,457 | $302,795 | $120,340 | $182,455 |
| 2015 | $3,306 | $298,249 | $118,534 | $179,715 |
| 2014 | $3,358 | $292,409 | $116,213 | $176,196 |
Source: Public Records
Map
Nearby Homes
- 535 Ridgecrest Dr
- 747 Southwick St
- 545 W Santa Paula St
- 612 Shasta Dr
- 0 Foothill Rd
- 428 Anacapa Terrace
- 525 W Santa Barbara St
- 423 Atmore Dr
- 605 Elfred Ct
- 752 Fillmore St
- 362 W Santa Barbara St
- 324 W Santa Barbara St
- 0 Dickenson Rd
- 352 Moultrie Place
- 342 Princeton St
- 975 W Telegraph Rd Unit 34
- 975 W Telegraph Rd Unit 126
- 975 W Telegraph Rd Unit 40
- 455 Snowdrop Ln
- 1856 Jojoba Dr
- 360 Hardison St
- 376 Hardison St
- 667 Southwick St
- 662 Southwick St
- 352 Hardison St
- 384 Hardison St
- 658 Richard Rd
- 369 Hardison St
- 361 Hardison St
- 377 Hardison St
- 344 Hardison St
- 353 Hardison St
- 666 Southwick St
- 664 Richard Rd
- 385 Hardison St
- 671 Southwick St
- 345 Hardison St
- 336 Hardison St
- 368 Cameron St
- 404 Hardison St