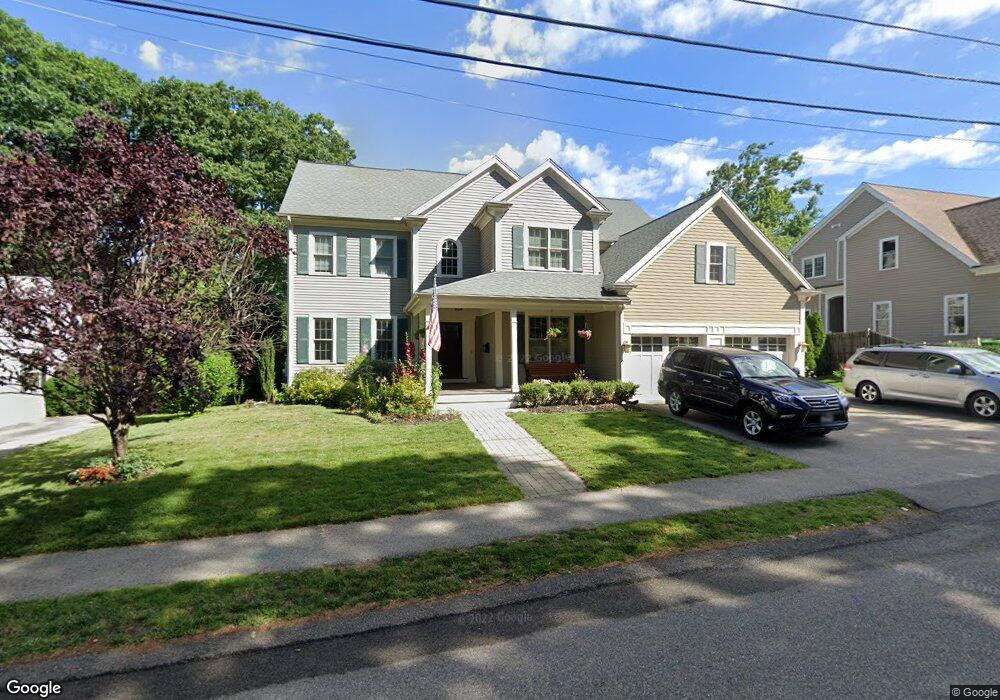
368 Hillcrest Rd Unit 1 Needham, MA 02492
Estimated Value: $2,485,575 - $2,837,000
5
Beds
4
Baths
4,300
Sq Ft
$615/Sq Ft
Est. Value
About This Home
This home is located at 368 Hillcrest Rd Unit 1, Needham, MA 02492 and is currently estimated at $2,644,894, approximately $615 per square foot. 368 Hillcrest Rd Unit 1 is a home located in Norfolk County with nearby schools including Mitchell Elementary School, High Rock Middle School, and Pollard Middle School.
Ownership History
Date
Name
Owned For
Owner Type
Purchase Details
Closed on
Aug 31, 2012
Sold by
368 Hillcrest Llc
Bought by
Damelio John and Damelio Vanessa
Current Estimated Value
Home Financials for this Owner
Home Financials are based on the most recent Mortgage that was taken out on this home.
Original Mortgage
$765,000
Outstanding Balance
$529,099
Interest Rate
3.56%
Mortgage Type
Purchase Money Mortgage
Estimated Equity
$2,115,795
Purchase Details
Closed on
Apr 15, 2011
Sold by
Fingar Gregory C Est and Fingar
Bought by
368 Hillcrest Llc
Home Financials for this Owner
Home Financials are based on the most recent Mortgage that was taken out on this home.
Original Mortgage
$957,000
Interest Rate
4.89%
Mortgage Type
Purchase Money Mortgage
Create a Home Valuation Report for This Property
The Home Valuation Report is an in-depth analysis detailing your home's value as well as a comparison with similar homes in the area
Home Values in the Area
Average Home Value in this Area
Purchase History
| Date | Buyer | Sale Price | Title Company |
|---|---|---|---|
| Damelio John | $1,265,000 | -- | |
| Damelio John | $1,265,000 | -- | |
| 368 Hillcrest Llc | $605,000 | -- | |
| 368 Hillcrest Llc | $605,000 | -- |
Source: Public Records
Mortgage History
| Date | Status | Borrower | Loan Amount |
|---|---|---|---|
| Open | Damelio John | $765,000 | |
| Closed | 368 Hillcrest Llc | $765,000 | |
| Previous Owner | 368 Hillcrest Llc | $957,000 |
Source: Public Records
Tax History Compared to Growth
Tax History
| Year | Tax Paid | Tax Assessment Tax Assessment Total Assessment is a certain percentage of the fair market value that is determined by local assessors to be the total taxable value of land and additions on the property. | Land | Improvement |
|---|---|---|---|---|
| 2025 | $22,851 | $2,155,800 | $801,100 | $1,354,700 |
| 2024 | $19,715 | $1,574,700 | $589,700 | $985,000 |
| 2023 | $19,522 | $1,497,100 | $589,700 | $907,400 |
| 2022 | $18,444 | $1,379,500 | $521,900 | $857,600 |
| 2021 | $17,975 | $1,379,500 | $521,900 | $857,600 |
| 2020 | $17,531 | $1,403,600 | $521,800 | $881,800 |
| 2019 | $16,572 | $1,337,500 | $474,400 | $863,100 |
| 2018 | $15,890 | $1,337,500 | $474,400 | $863,100 |
| 2017 | $14,555 | $1,224,100 | $474,400 | $749,700 |
| 2016 | $14,215 | $1,231,800 | $474,400 | $757,400 |
| 2015 | $13,907 | $1,231,800 | $474,400 | $757,400 |
| 2014 | $15,830 | $1,360,000 | $395,400 | $964,600 |
Source: Public Records
Map
Nearby Homes
- 332 Hillcrest Rd
- 190 Brookline St
- 23 Cheney St
- 62 Washington Ave
- 701 Greendale Ave
- 556 Webster St
- 9 Jayne Rd
- 26 Pinewood Rd
- 40 Otis St Unit L
- 42 Otis St Unit R
- 143 Hunting Rd
- 247 Broad Meadow Rd
- 39 Mark Lee Rd
- 883 Greendale Ave
- 36 Davenport Rd
- 154 Warren St
- 445 Hillside Ave
- 3 Crescent Rd
- 100 Rosemary Way Unit 129
- 100 Rosemary Way Unit 324
- 368 Hillcrest Rd
- 362 Hillcrest Rd
- 376 Hillcrest Rd
- 96 Brookline St
- 110 Brookline St
- 369 Hillcrest Rd
- 90 Brookline St
- 112 Brookline St
- 356 Hillcrest Rd
- 361 Hillcrest Rd
- 378 Hillcrest Rd
- 375 Hillcrest Rd
- 384 Hillcrest Rd
- 84 Brookline St
- 349 Hillcrest Rd
- 381 Hillcrest Rd
- 58 Falcon St
- 66 Falcon St
- 348 Hillcrest Rd
- 41 Colby St