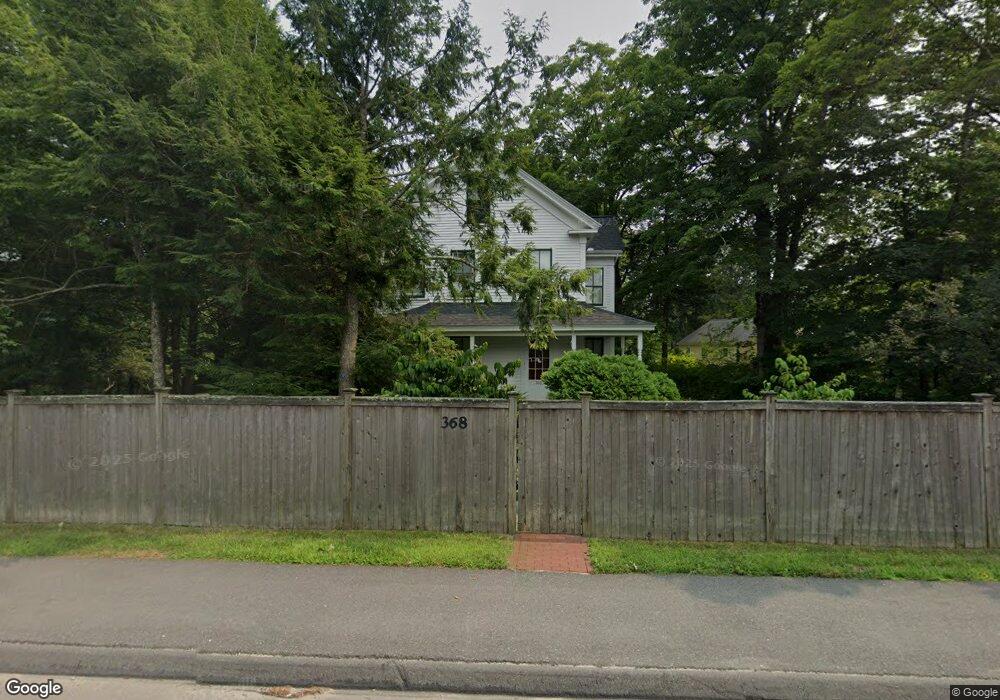
368 Main St Medfield, MA 02052
Estimated Value: $929,567 - $1,489,000
4
Beds
2
Baths
2,442
Sq Ft
$476/Sq Ft
Est. Value
About This Home
This home is located at 368 Main St, Medfield, MA 02052 and is currently estimated at $1,162,892, approximately $476 per square foot. 368 Main St is a home located in Norfolk County with nearby schools including Memorial School, Ralph Wheelock School, and Dale Street School.
Ownership History
Date
Name
Owned For
Owner Type
Purchase Details
Closed on
Aug 11, 1989
Sold by
West Roland H
Bought by
Coen Donald M
Current Estimated Value
Home Financials for this Owner
Home Financials are based on the most recent Mortgage that was taken out on this home.
Original Mortgage
$165,000
Interest Rate
9.93%
Mortgage Type
Purchase Money Mortgage
Create a Home Valuation Report for This Property
The Home Valuation Report is an in-depth analysis detailing your home's value as well as a comparison with similar homes in the area
Home Values in the Area
Average Home Value in this Area
Purchase History
| Date | Buyer | Sale Price | Title Company |
|---|---|---|---|
| Coen Donald M | $265,000 | -- | |
| Coen Donald M | $265,000 | -- |
Source: Public Records
Mortgage History
| Date | Status | Borrower | Loan Amount |
|---|---|---|---|
| Open | Coen Donald M | $133,000 | |
| Closed | Coen Donald M | $154,000 | |
| Closed | Coen Donald M | $165,000 |
Source: Public Records
Tax History
| Year | Tax Paid | Tax Assessment Tax Assessment Total Assessment is a certain percentage of the fair market value that is determined by local assessors to be the total taxable value of land and additions on the property. | Land | Improvement |
|---|---|---|---|---|
| 2025 | $10,489 | $760,100 | $376,700 | $383,400 |
| 2024 | $10,230 | $698,800 | $349,100 | $349,700 |
| 2023 | $10,023 | $649,600 | $330,800 | $318,800 |
| 2022 | $9,328 | $535,500 | $312,400 | $223,100 |
| 2021 | $9,042 | $509,100 | $303,200 | $205,900 |
| 2020 | $8,813 | $494,300 | $295,800 | $198,500 |
| 2019 | $8,590 | $480,700 | $284,800 | $195,900 |
| 2018 | $7,793 | $457,600 | $266,400 | $191,200 |
| 2017 | $7,573 | $448,400 | $257,200 | $191,200 |
| 2016 | $7,481 | $446,600 | $255,400 | $191,200 |
| 2015 | $6,875 | $428,600 | $247,200 | $181,400 |
| 2014 | $6,675 | $414,100 | $232,700 | $181,400 |
Source: Public Records
Map
Nearby Homes
- 433 Main St Unit 4
- 17 Rolling Ln
- 40 Hearthstone Dr
- 17 Fairview Rd
- 12 Belknap Rd
- 8 Turtlebrook Way
- 23 Winter St
- 21 Winter St
- 15 Homestead Dr
- 3 Shining Valley Cir
- 104 Wood End Ln
- 111 Elm St
- 1 Chestnut Ln
- 4 Blacksmith Dr
- 3 Copperwood Rd
- 25 Forest St
- 22 Sunset Way Unit 22
- 115 High St
- 26 Dover Dr
- 144 Pine St
Your Personal Tour Guide
Ask me questions while you tour the home.