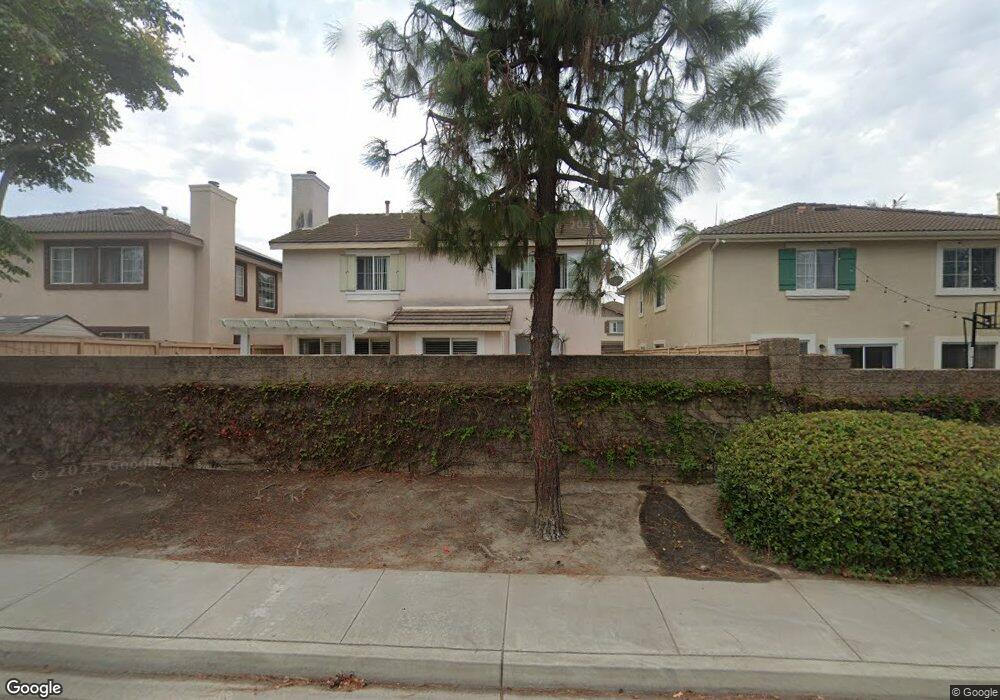
368 Spring Canyon Way Oceanside, CA 92057
San Luis Rey NeighborhoodEstimated Value: $961,000 - $1,084,000
4
Beds
3
Baths
2,650
Sq Ft
$379/Sq Ft
Est. Value
About This Home
This home is located at 368 Spring Canyon Way, Oceanside, CA 92057 and is currently estimated at $1,005,669, approximately $379 per square foot. 368 Spring Canyon Way is a home located in San Diego County with nearby schools including Nichols Elementary School, Cesar Chavez Middle School, and El Camino High School.
Ownership History
Date
Name
Owned For
Owner Type
Purchase Details
Closed on
Aug 8, 2016
Sold by
Connor Dennis L O and Connor Annie O
Bought by
Connor Denis L O and Connor Annie O
Current Estimated Value
Purchase Details
Closed on
Jul 27, 2010
Sold by
Oconnor Sally C
Bought by
Oconnor Sean
Purchase Details
Closed on
Jul 7, 2010
Sold by
Sebastian David Shane and Sebastian Laura Marie
Bought by
Oconnor Sean and Oconnor Denis L
Purchase Details
Closed on
Feb 14, 2002
Sold by
Fieldstone River Ranch North Llc
Bought by
Sebastian David Shane and Sebastian Laura Marie
Home Financials for this Owner
Home Financials are based on the most recent Mortgage that was taken out on this home.
Original Mortgage
$252,350
Interest Rate
6.78%
Create a Home Valuation Report for This Property
The Home Valuation Report is an in-depth analysis detailing your home's value as well as a comparison with similar homes in the area
Home Values in the Area
Average Home Value in this Area
Purchase History
We collect this data history from publicly available records. To have your information removed, we recommend requesting removal directly through your county’s website.
| Date | Buyer | Sale Price | Title Company |
|---|---|---|---|
| Connor Denis L O | -- | None Available | |
| Oconnor Sean | -- | None Available | |
| Oconnor Sean | $390,000 | Chicago Title Co | |
| Sebastian David Shane | $315,500 | First American Title |
Source: Public Records
Mortgage History
We collect this data history from publicly available records. To have your information removed, we recommend requesting removal directly through your county’s website.
| Date | Status | Borrower | Loan Amount |
|---|---|---|---|
| Previous Owner | Sebastian David Shane | $252,350 |
Source: Public Records
Tax History
| Year | Tax Paid | Tax Assessment Tax Assessment Total Assessment is a certain percentage of the fair market value that is determined by local assessors to be the total taxable value of land and additions on the property. | Land | Improvement |
|---|---|---|---|---|
| 2025 | $5,437 | $499,644 | $190,058 | $309,586 |
| 2024 | $5,437 | $489,848 | $186,332 | $303,516 |
| 2023 | $5,268 | $480,244 | $182,679 | $297,565 |
| 2022 | $5,187 | $470,829 | $179,098 | $291,731 |
| 2021 | $5,206 | $461,598 | $175,587 | $286,011 |
| 2020 | $5,044 | $456,866 | $173,787 | $283,079 |
| 2019 | $4,896 | $447,909 | $170,380 | $277,529 |
| 2018 | $4,843 | $439,128 | $167,040 | $272,088 |
| 2017 | $71 | $430,518 | $163,765 | $266,753 |
| 2016 | $4,596 | $422,077 | $160,554 | $261,523 |
| 2015 | $4,461 | $415,738 | $158,143 | $257,595 |
| 2014 | $4,287 | $407,596 | $155,046 | $252,550 |
Source: Public Records
Map
Nearby Homes
- 338 Spring Canyon Way
- 4444 Silver Birch Way
- 328 Liberty Way
- 4330 Forest Ranch Way
- 4310 Forest Ranch Way
- 305 Liberty Way
- 250 Liberty Way
- 167 Avenida Del Gado
- 153 Avenida Del Gado
- 62 Hummingbird Ln
- 181 Magdalena Dr
- 65 Hummingbird Ln
- 176 Flicker Ln
- 287 Robin Ln
- 106 Pheasant Ln
- 188 Flicker Ln
- 205 Mockingbird Ln Unit T
- 4128 Via Del Rey
- 41 Hummingbird Ln
- 4156 Sitio Cielo
- 364 Spring Canyon Way
- 372 Spring Canyon Way Unit 2
- 376 Spring Canyon Way Unit 2
- 360 Spring Canyon Way
- 364 Aspen Creek Way
- 360 Aspen Creek Way Unit 2
- 369 Spring Canyon Way
- 375 Spring Canyon Way
- 365 Spring Canyon Way
- 377 Spring Canyon Way
- 361 Spring Canyon Way Unit 2
- 356 Aspen Creek Way Unit 2
- 354 Spring Canyon Way
- 381 Spring Canyon Way
- 357 Spring Canyon Way
- 386 River Ranch Way Unit 2
- 390 River Ranch Way
- 357 Aspen Creek Way
- 385 Spring Canyon Way
- 352 Aspen Creek Way
Your Personal Tour Guide
Ask me questions while you tour the home.