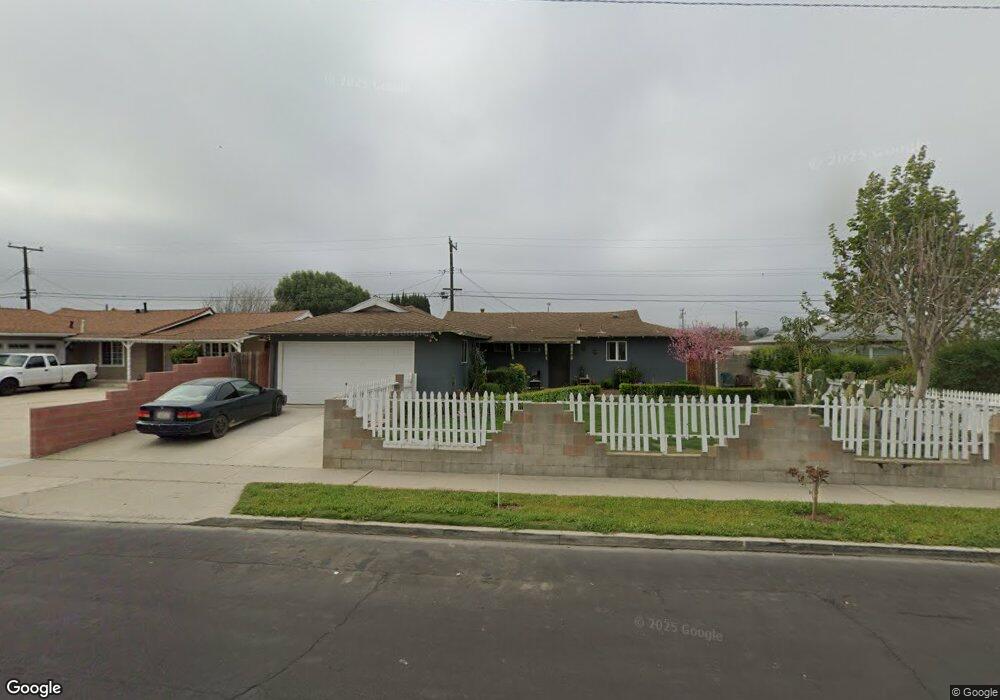
368 Susan Ave Moorpark, CA 93021
Estimated Value: $631,000 - $695,030
3
Beds
2
Baths
1,068
Sq Ft
$617/Sq Ft
Est. Value
About This Home
This home is located at 368 Susan Ave, Moorpark, CA 93021 and is currently estimated at $659,258, approximately $617 per square foot. 368 Susan Ave is a home located in Ventura County with nearby schools including Peach Hill Academy, Mesa Verde Middle School, and Moorpark High School.
Ownership History
Date
Name
Owned For
Owner Type
Purchase Details
Closed on
Jan 4, 2022
Sold by
Cano Ivan R
Bought by
Rodriguez Armando Amezcua and Gonzales Miguel A
Current Estimated Value
Purchase Details
Closed on
Oct 13, 2020
Sold by
Cano Roberto and Cano Irma
Bought by
Cano Ivan R
Home Financials for this Owner
Home Financials are based on the most recent Mortgage that was taken out on this home.
Original Mortgage
$323,700
Interest Rate
2.8%
Mortgage Type
New Conventional
Purchase Details
Closed on
Nov 4, 2015
Sold by
Walker Cath M
Bought by
Cano Ivan and Cano Roberto
Home Financials for this Owner
Home Financials are based on the most recent Mortgage that was taken out on this home.
Original Mortgage
$338,751
Interest Rate
3.75%
Mortgage Type
FHA
Purchase Details
Closed on
Dec 8, 1999
Sold by
Bentley Marie T
Bought by
Marie T Bentley Trust and Bentley Marie T
Create a Home Valuation Report for This Property
The Home Valuation Report is an in-depth analysis detailing your home's value as well as a comparison with similar homes in the area
Home Values in the Area
Average Home Value in this Area
Purchase History
| Date | Buyer | Sale Price | Title Company |
|---|---|---|---|
| Rodriguez Armando Amezcua | $570,000 | Provident Title | |
| Cano Ivan R | -- | Wfg National Title Co Of Ca | |
| Cano Ivan | $345,000 | Consumers Title Company | |
| Marie T Bentley Trust | -- | Fidelity National Title |
Source: Public Records
Mortgage History
| Date | Status | Borrower | Loan Amount |
|---|---|---|---|
| Previous Owner | Cano Ivan R | $323,700 | |
| Previous Owner | Cano Ivan | $338,751 |
Source: Public Records
Tax History Compared to Growth
Tax History
| Year | Tax Paid | Tax Assessment Tax Assessment Total Assessment is a certain percentage of the fair market value that is determined by local assessors to be the total taxable value of land and additions on the property. | Land | Improvement |
|---|---|---|---|---|
| 2025 | $7,865 | $737,539 | $479,666 | $257,873 |
| 2024 | $7,865 | $723,078 | $470,261 | $252,817 |
| 2023 | $7,690 | $708,900 | $461,040 | $247,860 |
| 2022 | $4,135 | $384,849 | $249,874 | $134,975 |
| 2021 | $4,125 | $377,303 | $244,974 | $132,329 |
| 2020 | $4,086 | $373,436 | $242,463 | $130,973 |
| 2019 | $3,993 | $366,114 | $237,709 | $128,405 |
| 2018 | $3,951 | $358,937 | $233,049 | $125,888 |
| 2017 | $3,867 | $351,900 | $228,480 | $123,420 |
| 2016 | $3,869 | $345,000 | $224,000 | $121,000 |
| 2015 | $560 | $46,889 | $15,275 | $31,614 |
| 2014 | $546 | $45,973 | $14,977 | $30,996 |
Source: Public Records
Map
Nearby Homes
- 285 2nd St
- 445 Millard St
- 31 Fremont Ave
- 540 Spring Rd Unit 94
- 540 Spring Rd Unit 93
- 13191 Westcott Ct
- 150 Majestic Ct Unit 1102
- 4540 Mill Valley Rd
- 4529 N Canyonlands Rd
- 4506 N Canyonlands Rd
- 4543 Silverbell Cir
- 13191 Honeybee St
- 1363 Walnut Canyon Rd
- 13729 Bear Valley Rd
- 4175 Shady Point Dr
- 13749 Gunsmoke Rd
- 4471 Skyglen Ct
- 4833 E Beltramo Ranch Rd
- Plan 2428 Modeled at The Bungalows at Beltramo