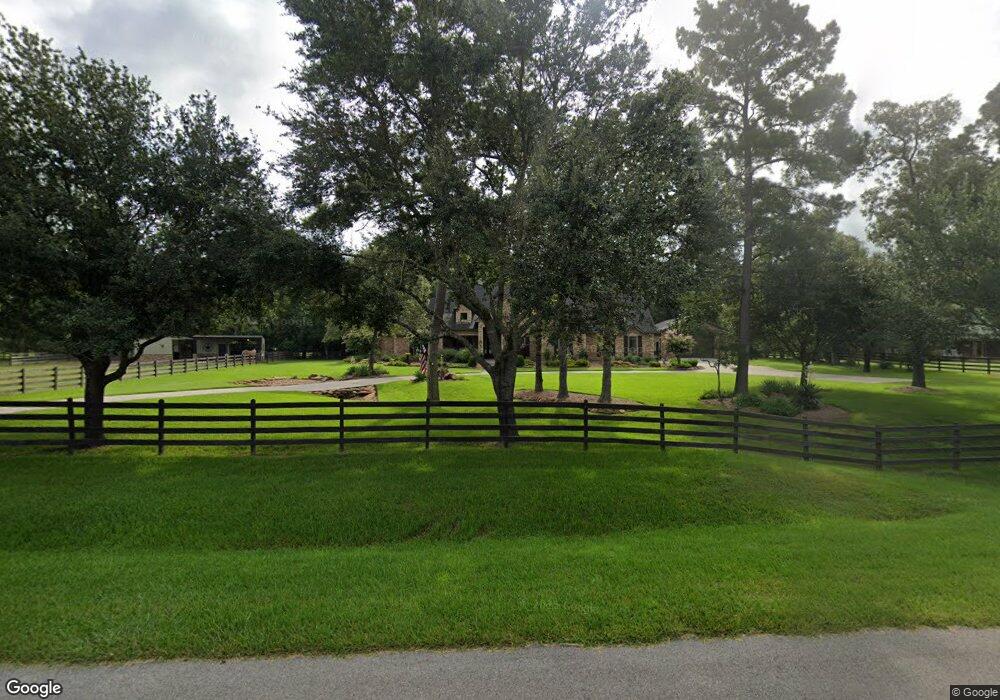
36802 High Chaparral Magnolia, TX 77355
Estimated Value: $776,845 - $930,000
4
Beds
3
Baths
3,179
Sq Ft
$270/Sq Ft
Est. Value
About This Home
This home is located at 36802 High Chaparral, Magnolia, TX 77355 and is currently estimated at $859,211, approximately $270 per square foot. 36802 High Chaparral is a home located in Montgomery County with nearby schools including Magnolia Elementary School, Magnolia Sixth Grade Campus, and Magnolia Junior High School.
Ownership History
Date
Name
Owned For
Owner Type
Purchase Details
Closed on
Aug 14, 2015
Sold by
Burkett James R and Burkett Cynthia S
Bought by
Calhoun Randy and Calhoun Kimberly S
Current Estimated Value
Home Financials for this Owner
Home Financials are based on the most recent Mortgage that was taken out on this home.
Original Mortgage
$408,000
Outstanding Balance
$309,216
Interest Rate
3%
Mortgage Type
Adjustable Rate Mortgage/ARM
Estimated Equity
$549,995
Purchase Details
Closed on
Mar 22, 2010
Sold by
Atkins Bruce W and Atkins Peggy A
Bought by
Burkett James R and Burkett Cynthia A
Home Financials for this Owner
Home Financials are based on the most recent Mortgage that was taken out on this home.
Original Mortgage
$288,000
Interest Rate
4.93%
Mortgage Type
New Conventional
Purchase Details
Closed on
Dec 4, 2000
Sold by
Jack Frey Properties Inc
Bought by
Calhoun Randy M and Calhoun Kimberly S
Create a Home Valuation Report for This Property
The Home Valuation Report is an in-depth analysis detailing your home's value as well as a comparison with similar homes in the area
Home Values in the Area
Average Home Value in this Area
Purchase History
| Date | Buyer | Sale Price | Title Company |
|---|---|---|---|
| Calhoun Randy | -- | None Available | |
| Burkett James R | -- | Stewart Title Houston Div | |
| Calhoun Randy M | -- | -- |
Source: Public Records
Mortgage History
| Date | Status | Borrower | Loan Amount |
|---|---|---|---|
| Open | Calhoun Randy | $408,000 | |
| Previous Owner | Burkett James R | $288,000 |
Source: Public Records
Tax History Compared to Growth
Tax History
| Year | Tax Paid | Tax Assessment Tax Assessment Total Assessment is a certain percentage of the fair market value that is determined by local assessors to be the total taxable value of land and additions on the property. | Land | Improvement |
|---|---|---|---|---|
| 2025 | $9,067 | $841,000 | $250,840 | $590,160 |
| 2024 | $9,004 | $827,717 | -- | -- |
| 2023 | $9,004 | $752,470 | $250,840 | $609,520 |
| 2022 | $12,071 | $684,060 | $206,060 | $593,940 |
| 2021 | $11,147 | $599,710 | $130,420 | $469,290 |
| 2020 | $11,414 | $564,000 | $130,420 | $433,580 |
| 2019 | $10,331 | $513,000 | $130,420 | $382,580 |
| 2018 | $9,767 | $503,720 | $80,840 | $422,880 |
| 2017 | $10,876 | $512,920 | $80,840 | $432,080 |
| 2016 | $10,815 | $510,000 | $80,840 | $429,160 |
| 2015 | $8,280 | $435,600 | $80,840 | $400,290 |
| 2014 | $8,280 | $396,000 | $80,840 | $369,710 |
Source: Public Records
Map
Nearby Homes
- 28632 Beth Marie
- 28523 Beth Marie
- 28543 Beth Marie
- 16912 Wagon Wheel Rd
- 0 Boothill Rd Unit 38015944
- 16407 Wagon Wheel Rd
- 16633 Cimmaron Dr
- TBD Cimmaron Dr
- 420 Whispering Meadow
- 522 Whispering Meadow
- 322 Whispering Meadow
- 0 Frontier Rd
- 000 Whispering Meadow
- 15937 Stagecoach Rd
- 37432 Clubhouse Ln
- 15823 Stagecoach Rd
- 36218 Post Oak Cir
- 603 Terri Ln
- 15450 Shady Oaks Dr
- 28733 Lakeside Green
- 36732 High Chaparral
- 35613 High Chaparral
- 36722 High Chaparral
- 28313 Breezy Ct
- 28332 Breezy Ct
- 36733 High Chaparral
- 36712 High Chaparral
- 28722 Beth Marie
- 28323 Breezy Ct
- 28333 Breezy Ct
- 36823 High Chaparral
- 36632 High Chaparral
- 28732 Beth Marie
- 28622 Beth Marie
- 36833 High Chaparral
- 36622 High Chaparral
- 36633 High Chaparral
- 28742 Beth Marie
- 28612 Beth Marie
- 36913 High Chaparral