36811 235th Ave Browerville, MN 56438
Estimated Value: $193,000 - $312,293
3
Beds
2
Baths
1,362
Sq Ft
$197/Sq Ft
Est. Value
About This Home
This home is located at 36811 235th Ave, Browerville, MN 56438 and is currently estimated at $267,823, approximately $196 per square foot. 36811 235th Ave is a home with nearby schools including Browerville Elementary School and Browerville Secondary School.
Ownership History
Date
Name
Owned For
Owner Type
Purchase Details
Closed on
Jul 7, 2021
Sold by
Winter Doris E
Bought by
Theiler Nicole K
Current Estimated Value
Home Financials for this Owner
Home Financials are based on the most recent Mortgage that was taken out on this home.
Original Mortgage
$237,500
Outstanding Balance
$215,692
Interest Rate
2.96%
Mortgage Type
New Conventional
Estimated Equity
$52,131
Purchase Details
Closed on
Dec 10, 2010
Sold by
Winter Lyle D and Winter Doris E
Bought by
Hoelscher Mark B and Hoelscher Carla K
Create a Home Valuation Report for This Property
The Home Valuation Report is an in-depth analysis detailing your home's value as well as a comparison with similar homes in the area
Home Values in the Area
Average Home Value in this Area
Purchase History
| Date | Buyer | Sale Price | Title Company |
|---|---|---|---|
| Theiler Nicole K | $250,000 | Home Town Abstract & Title L | |
| Hoelscher Mark B | -- | Home Town Title Llc | |
| Theiler Nicole Nicole | $250,000 | -- |
Source: Public Records
Mortgage History
| Date | Status | Borrower | Loan Amount |
|---|---|---|---|
| Open | Theiler Nicole K | $237,500 | |
| Closed | Theiler Nicole Nicole | $250,000 |
Source: Public Records
Tax History Compared to Growth
Tax History
| Year | Tax Paid | Tax Assessment Tax Assessment Total Assessment is a certain percentage of the fair market value that is determined by local assessors to be the total taxable value of land and additions on the property. | Land | Improvement |
|---|---|---|---|---|
| 2025 | $2,968 | $257,500 | $69,600 | $187,900 |
| 2024 | $2,840 | $282,700 | $68,700 | $214,000 |
| 2023 | $2,240 | $265,600 | $68,700 | $196,900 |
| 2022 | $1,258 | $201,100 | $59,300 | $141,800 |
| 2021 | $1,108 | $137,800 | $35,700 | $102,100 |
| 2020 | $982 | $126,700 | $32,700 | $94,000 |
| 2019 | $1,592 | $117,800 | $34,500 | $83,300 |
| 2018 | $958 | $153,800 | $33,200 | $120,600 |
| 2017 | $1,038 | $111,700 | $34,800 | $76,900 |
| 2016 | $1,086 | $123,800 | $36,000 | $87,800 |
| 2015 | $1,102 | $0 | $0 | $0 |
| 2014 | -- | $0 | $0 | $0 |
Source: Public Records
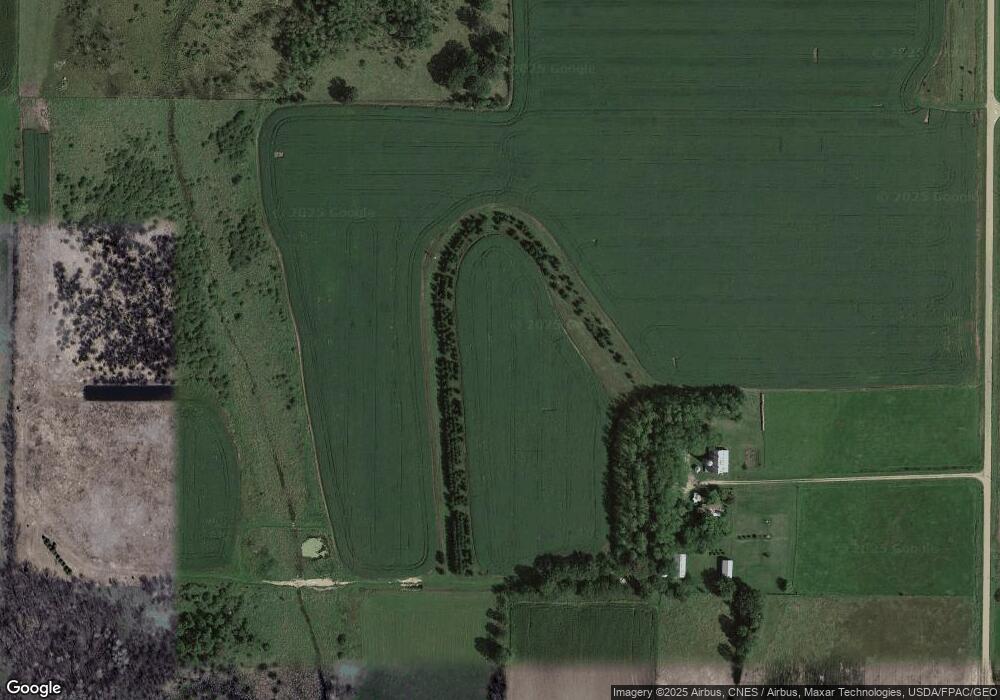
Map
Nearby Homes