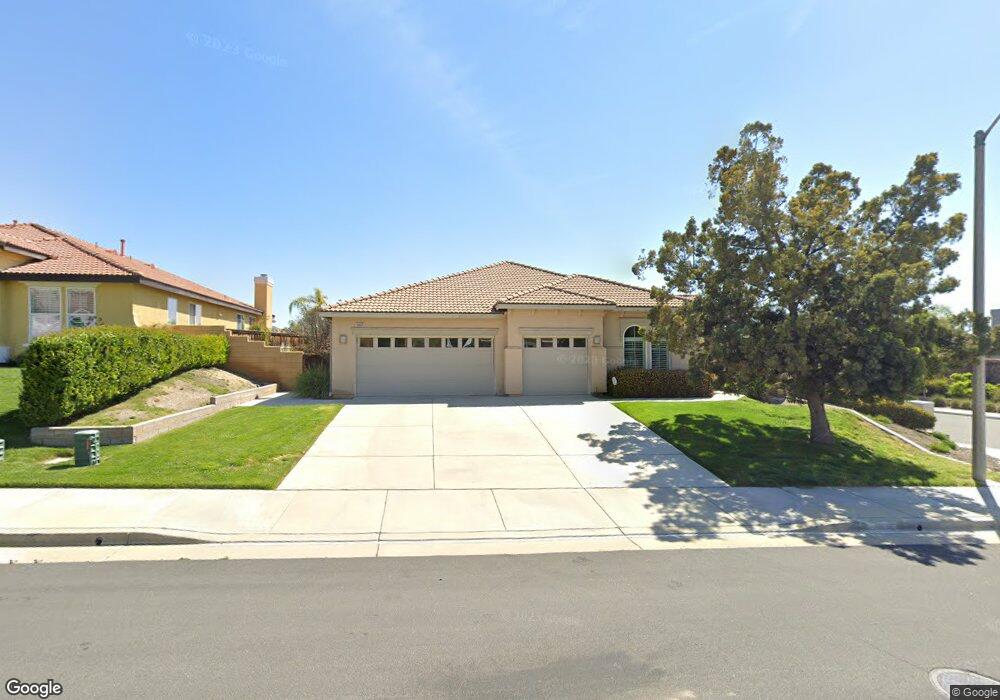
36826 Pebley Ct Winchester, CA 92596
Estimated Value: $696,491 - $750,000
4
Beds
3
Baths
2,733
Sq Ft
$263/Sq Ft
Est. Value
About This Home
This home is located at 36826 Pebley Ct, Winchester, CA 92596 and is currently estimated at $718,873, approximately $263 per square foot. 36826 Pebley Ct is a home located in Riverside County with nearby schools including French Valley Elementary School, Bella Vista Middle School, and Chaparral High School.
Ownership History
Date
Name
Owned For
Owner Type
Purchase Details
Closed on
Aug 20, 2010
Sold by
Williams Kevin Rishard and Williams Cynthia Lynn
Bought by
Kulsick Maryanne R and Maryanne R Kulsick Family Trust
Current Estimated Value
Purchase Details
Closed on
Sep 1, 2004
Sold by
Greer Gary B and Greer April L
Bought by
Williams Kevin Rishard and Williams Cynthia Lynn
Home Financials for this Owner
Home Financials are based on the most recent Mortgage that was taken out on this home.
Original Mortgage
$436,905
Interest Rate
6.99%
Mortgage Type
Purchase Money Mortgage
Purchase Details
Closed on
Jun 29, 2004
Sold by
Beazer Homes Holdings Corp
Bought by
Greer Gary B and Greer April L
Home Financials for this Owner
Home Financials are based on the most recent Mortgage that was taken out on this home.
Original Mortgage
$328,750
Interest Rate
5.87%
Mortgage Type
Purchase Money Mortgage
Create a Home Valuation Report for This Property
The Home Valuation Report is an in-depth analysis detailing your home's value as well as a comparison with similar homes in the area
Home Values in the Area
Average Home Value in this Area
Purchase History
| Date | Buyer | Sale Price | Title Company |
|---|---|---|---|
| Kulsick Maryanne R | $240,000 | Western Resources Title | |
| Williams Kevin Rishard | $460,000 | First American Title Co | |
| Greer Gary B | $411,000 | Fidelity National Title Co |
Source: Public Records
Mortgage History
| Date | Status | Borrower | Loan Amount |
|---|---|---|---|
| Previous Owner | Williams Kevin Rishard | $436,905 | |
| Previous Owner | Greer Gary B | $328,750 |
Source: Public Records
Tax History Compared to Growth
Tax History
| Year | Tax Paid | Tax Assessment Tax Assessment Total Assessment is a certain percentage of the fair market value that is determined by local assessors to be the total taxable value of land and additions on the property. | Land | Improvement |
|---|---|---|---|---|
| 2025 | $4,229 | $307,340 | $76,864 | $230,476 |
| 2023 | $4,229 | $295,407 | $73,880 | $221,527 |
| 2022 | $4,044 | $289,616 | $72,432 | $217,184 |
| 2021 | $3,914 | $283,938 | $71,012 | $212,926 |
| 2020 | $3,815 | $281,027 | $70,284 | $210,743 |
| 2019 | $3,658 | $275,517 | $68,906 | $206,611 |
| 2018 | $3,484 | $270,115 | $67,555 | $202,560 |
| 2017 | $3,433 | $264,820 | $66,231 | $198,589 |
| 2016 | $3,374 | $259,629 | $64,933 | $194,696 |
| 2015 | $3,323 | $255,730 | $63,958 | $191,772 |
| 2014 | $3,242 | $250,722 | $62,706 | $188,016 |
Source: Public Records
Map
Nearby Homes
- 36628 Chantecler Rd
- 0 Auld Rd Unit SW22005140
- 37052 Whispering Hills Dr
- 31851 Pepper Tree St
- 37068 Edgemont Dr
- 36415 Flare Dr
- 36362 Arcs St
- 31796 Gimbal Way
- 31610 Wintergreen Way
- 36355 Amerigo Ln
- 32579 Breton Dr
- 36358 Matino Ln
- 48 Mazoe St
- 36316 Grazia Way Unit 167
- 36320 Grazia Way
- 31809 Delfina Way
- 0 Priscilla St
- 36462 Sweet Berry Ct
- 37093 Almond Cir
- 31572 Adour Way
- 36816 Pebley Ct
- 36806 Pebley Ct
- 36831 Pebley Ct
- 36821 Pebley Ct
- 36856 Pebley Ct
- 36796 Pebley Ct
- 36841 Pebley Ct
- 36867 Rancho Kiel Rd
- 36801 Pebley Ct
- 36851 Rancho Kiel Rd
- 36866 Pebley Ct
- 36883 Rancho Kiel Rd
- 36861 Pebley Ct
- 36786 Pebley Ct
- 36891 Rancho Kiel Rd
- 36781 Pebley Ct
- 36876 Pebley Ct
- 36843 Rancho Kiel Rd
- 36871 Pebley Ct