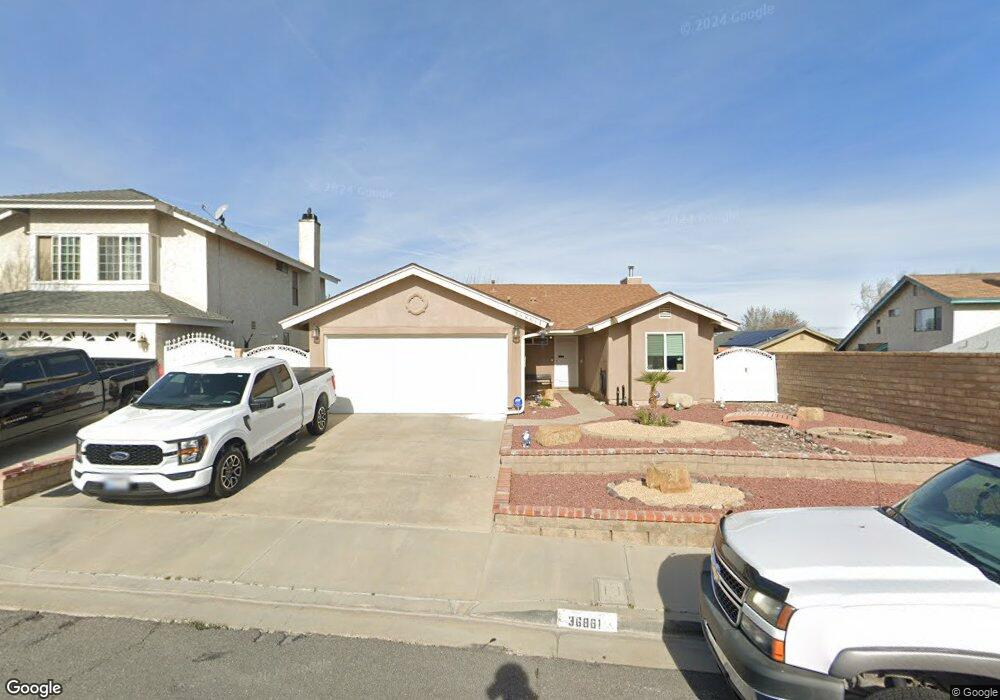
36861 Little Leaf Dr Palmdale, CA 93550
East Palmdale NeighborhoodEstimated Value: $446,000 - $589,325
3
Beds
2
Baths
1,296
Sq Ft
$378/Sq Ft
Est. Value
About This Home
This home is located at 36861 Little Leaf Dr, Palmdale, CA 93550 and is currently estimated at $489,831, approximately $377 per square foot. 36861 Little Leaf Dr is a home located in Los Angeles County with nearby schools including Barrel Springs Elementary School, Desert Willow Fine Arts, Science, & Technology Magnet Academy, and Palmdale High School.
Ownership History
Date
Name
Owned For
Owner Type
Purchase Details
Closed on
Aug 13, 2001
Sold by
Wakely Beverly
Bought by
Kussoy Bennett and Kussoy Lorna
Current Estimated Value
Home Financials for this Owner
Home Financials are based on the most recent Mortgage that was taken out on this home.
Original Mortgage
$86,000
Outstanding Balance
$33,402
Interest Rate
7.09%
Estimated Equity
$456,429
Purchase Details
Closed on
Jul 1, 1998
Sold by
Wakely Beverly
Bought by
Wakely Beverly and Kussoy Bennett
Purchase Details
Closed on
Apr 8, 1997
Sold by
Thun Steven J
Bought by
Wakely Van and Wakely Beverly
Home Financials for this Owner
Home Financials are based on the most recent Mortgage that was taken out on this home.
Original Mortgage
$73,162
Interest Rate
7.86%
Mortgage Type
FHA
Create a Home Valuation Report for This Property
The Home Valuation Report is an in-depth analysis detailing your home's value as well as a comparison with similar homes in the area
Home Values in the Area
Average Home Value in this Area
Purchase History
| Date | Buyer | Sale Price | Title Company |
|---|---|---|---|
| Kussoy Bennett | -- | Lawyers Title Company | |
| Wakely Beverly | -- | -- | |
| Wakely Van | $37,000 | Fidelity National Title Co | |
| Wakely Van | -- | Fidelity National Title Co |
Source: Public Records
Mortgage History
| Date | Status | Borrower | Loan Amount |
|---|---|---|---|
| Open | Kussoy Bennett | $86,000 | |
| Previous Owner | Wakely Van | $73,162 |
Source: Public Records
Tax History
| Year | Tax Paid | Tax Assessment Tax Assessment Total Assessment is a certain percentage of the fair market value that is determined by local assessors to be the total taxable value of land and additions on the property. | Land | Improvement |
|---|---|---|---|---|
| 2025 | $2,376 | $119,186 | $23,761 | $95,425 |
| 2024 | $2,376 | $116,850 | $23,296 | $93,554 |
| 2023 | $2,360 | $114,560 | $22,840 | $91,720 |
| 2022 | $2,279 | $112,315 | $22,393 | $89,922 |
| 2021 | $2,222 | $110,113 | $21,954 | $88,159 |
| 2019 | $2,164 | $106,849 | $21,303 | $85,546 |
| 2018 | $1,578 | $56,244 | $20,886 | $35,358 |
| 2016 | $2,003 | $100,689 | $20,076 | $80,613 |
| 2015 | $1,982 | $99,178 | $19,775 | $79,403 |
| 2014 | $1,963 | $97,236 | $19,388 | $77,848 |
Source: Public Records
Map
Nearby Homes
- 2725 Jojoba Terrace
- 2733 Coria Place
- 2553 Orchid Tree Dr
- 36913 Tobira Dr
- 36648 Spanish Broom Dr
- 2839 Nandina Dr
- 36647 Apache Plume Dr
- 3006 Via Primero
- 2554 Olive Dr Unit 101
- 2554 Olive Dr Unit 96
- 2554 Olive Dr Unit 116
- 2554 Olive Dr
- 2554 Olive Dr Unit 113
- 2554 Olive Dr Unit 188
- 2509 Joshua Hills Dr
- 2820 East Ave S
- 37012 Calle Bonita
- 0 Vac 52nd Ste Vic Nilgon St Unit 24003029
- 0 Vac Calle Grillo Vic Ave S Unit SR25200918
- 0 Vac Calle Grillo Vic Ave S Unit SR25200922
- 36855 Little Leaf Dr
- 36843 Spanish Broom Dr
- 36851 Spanish Broom Dr
- 36870 Apache Plume Dr
- 36849 Little Leaf Dr
- 36857 Spanish Broom Dr
- 36864 Apache Plume Dr
- 36858 Apache Plume Dr
- 36863 Spanish Broom Dr
- 36862 Little Leaf Dr
- 36852 Little Leaf Dr
- 36868 Little Leaf Dr
- 36845 Little Leaf Dr
- 36852 Apache Plume Dr
- 36841 Little Leaf Dr
- 36815 Spanish Broom Dr
- 36840 Spanish Broom Dr
- 36873 Spanish Broom Dr
- 36850 Spanish Broom Dr
- 36854 Spanish Broom Dr
Your Personal Tour Guide
Ask me questions while you tour the home.