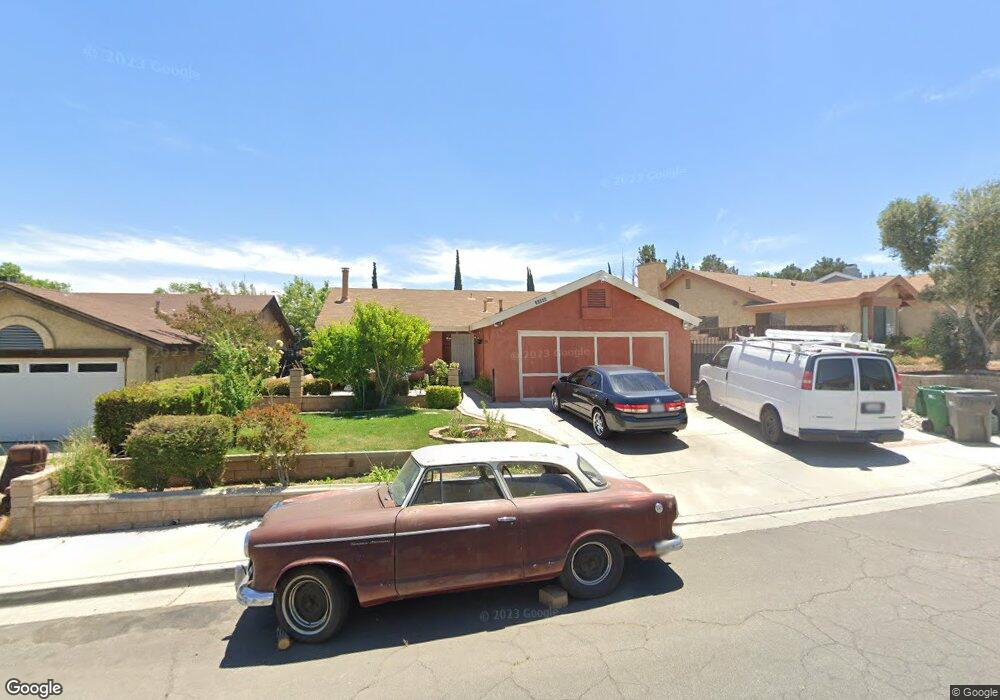
36868 Fiddleneck Ct Palmdale, CA 93550
East Palmdale NeighborhoodEstimated Value: $389,038 - $449,000
2
Beds
2
Baths
1,020
Sq Ft
$413/Sq Ft
Est. Value
About This Home
This home is located at 36868 Fiddleneck Ct, Palmdale, CA 93550 and is currently estimated at $421,760, approximately $413 per square foot. 36868 Fiddleneck Ct is a home located in Los Angeles County with nearby schools including Barrel Springs Elementary School, Desert Willow Fine Arts, Science, & Technology Magnet Academy, and Palmdale High School.
Ownership History
Date
Name
Owned For
Owner Type
Purchase Details
Closed on
Sep 30, 1998
Sold by
Deleon Navidad
Bought by
Deleon Julio R
Current Estimated Value
Home Financials for this Owner
Home Financials are based on the most recent Mortgage that was taken out on this home.
Original Mortgage
$61,298
Outstanding Balance
$13,293
Interest Rate
6.79%
Mortgage Type
FHA
Estimated Equity
$408,467
Purchase Details
Closed on
Sep 29, 1998
Sold by
Federal National Mortgage Association
Bought by
Deleon Julio R
Home Financials for this Owner
Home Financials are based on the most recent Mortgage that was taken out on this home.
Original Mortgage
$61,298
Outstanding Balance
$13,293
Interest Rate
6.79%
Mortgage Type
FHA
Estimated Equity
$408,467
Purchase Details
Closed on
Feb 17, 1998
Sold by
Koehler Mark C and Koehler Karen L
Bought by
Federal National Mortgage Association
Create a Home Valuation Report for This Property
The Home Valuation Report is an in-depth analysis detailing your home's value as well as a comparison with similar homes in the area
Home Values in the Area
Average Home Value in this Area
Purchase History
| Date | Buyer | Sale Price | Title Company |
|---|---|---|---|
| Deleon Julio R | -- | Chicago Title Co | |
| Deleon Julio R | $61,500 | Chicago Title Co | |
| Federal National Mortgage Association | $57,000 | North American Title Co |
Source: Public Records
Mortgage History
| Date | Status | Borrower | Loan Amount |
|---|---|---|---|
| Open | Deleon Julio R | $61,298 |
Source: Public Records
Tax History Compared to Growth
Tax History
| Year | Tax Paid | Tax Assessment Tax Assessment Total Assessment is a certain percentage of the fair market value that is determined by local assessors to be the total taxable value of land and additions on the property. | Land | Improvement |
|---|---|---|---|---|
| 2025 | $2,172 | $96,385 | $19,268 | $77,117 |
| 2024 | $2,172 | $94,496 | $18,891 | $75,605 |
| 2023 | $2,157 | $92,644 | $18,521 | $74,123 |
| 2022 | $2,086 | $90,828 | $18,158 | $72,670 |
| 2021 | $2,034 | $89,048 | $17,802 | $71,246 |
| 2020 | $2,006 | $88,136 | $17,620 | $70,516 |
| 2019 | $1,986 | $86,409 | $17,275 | $69,134 |
| 2018 | $1,960 | $84,716 | $16,937 | $67,779 |
| 2016 | $1,848 | $81,428 | $16,280 | $65,148 |
| 2015 | $1,828 | $80,206 | $16,036 | $64,170 |
| 2014 | $1,812 | $78,635 | $15,722 | $62,913 |
Source: Public Records
Map
Nearby Homes
- 36961 Spanish Broom Dr
- 36908 Spanish Broom Dr
- 36868 Little Leaf Dr
- 2554 Olive Dr Unit 31
- 2554 Olive Dr Unit 22
- 2554 Olive Dr Unit 12
- 2719 Fairfield Ave
- 0 Vac Cor 15th Ste Ave Q Unit SR25033119
- 0 Vac Calle Grillo Vic Ave S Unit SR25200922
- 0 Vac Calle Grillo Vic Ave S Unit SR25200918
- 0 Vac 52nd Ste Vic Nilgon St Unit 24003029
- 3 Street East and Palmdale Blvd
- 2733 Coria Place
- 2810 Juniper Dr
- 36647 Apache Plume Dr
- 2815 Juniper Dr
- 36664 Spanish Broom Dr
- 36724 Petra Dr
- 36648 Spanish Broom Dr
- 2936 Tumbleweed Dr
- 36862 Fiddleneck Ct
- 36874 Fiddleneck Ct
- 36917 Spanish Broom Dr
- 36856 Fiddleneck Ct
- 36909 Spanish Broom Dr
- 36935 Spanish Broom Dr
- 36850 Fiddleneck Ct
- 36865 Fiddleneck Ct
- 36859 Fiddleneck Ct
- 36905 Spanish Broom Dr
- 36941 Spanish Broom Dr
- 36926 Spanish Broom Dr
- 36855 Fiddleneck Ct
- 36920 Spanish Broom Dr
- 36930 Spanish Broom Dr
- 36844 Fiddleneck Ct
- 36916 Spanish Broom Dr
- 36883 Santolina Dr
- 36934 Spanish Broom Dr
- 36851 Fiddleneck Ct