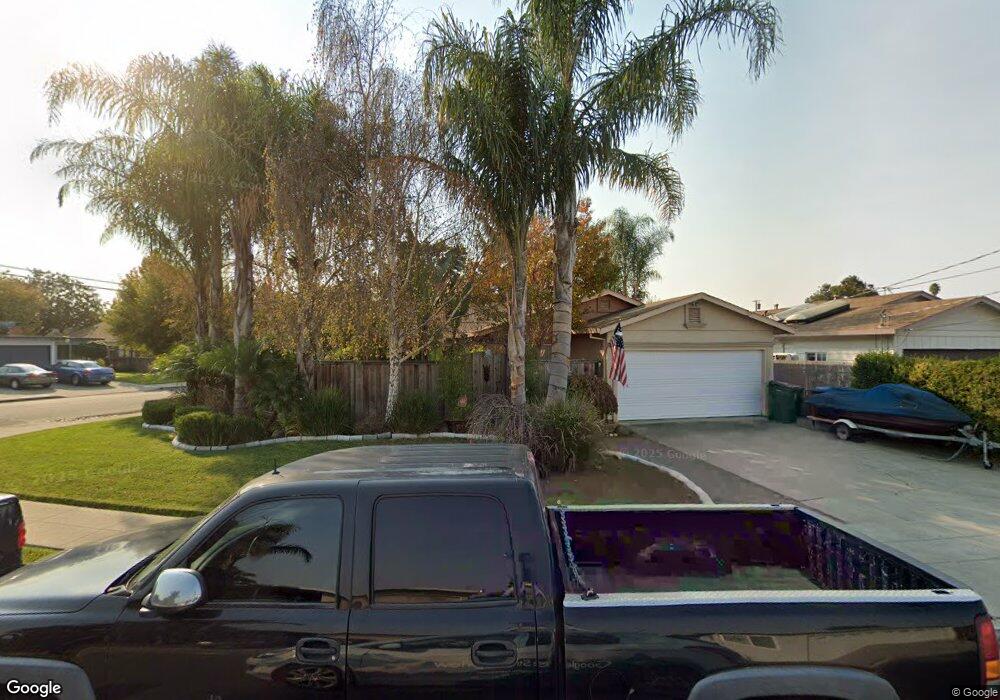
36877 Munyan St Newark, CA 94560
Estimated Value: $1,003,955 - $1,165,000
4
Beds
2
Baths
1,064
Sq Ft
$1,001/Sq Ft
Est. Value
About This Home
This home is located at 36877 Munyan St, Newark, CA 94560 and is currently estimated at $1,064,739, approximately $1,000 per square foot. 36877 Munyan St is a home located in Alameda County with nearby schools including Newark Junior High School, Newark Memorial High School, and St. Edward School.
Ownership History
Date
Name
Owned For
Owner Type
Purchase Details
Closed on
Nov 22, 2005
Sold by
Tamse Melba L
Bought by
Tamse Melba L and Kuehn Christopher N
Current Estimated Value
Purchase Details
Closed on
Mar 10, 1999
Sold by
Tamse Melba L and Roldan Edward
Bought by
Tamse Melba L
Home Financials for this Owner
Home Financials are based on the most recent Mortgage that was taken out on this home.
Original Mortgage
$210,500
Outstanding Balance
$50,858
Interest Rate
6.73%
Estimated Equity
$1,013,881
Purchase Details
Closed on
Aug 26, 1997
Sold by
Tuyor Joaquin V and Tuyor Aurelia E
Bought by
Tamse Melba L and Roldan Edward
Home Financials for this Owner
Home Financials are based on the most recent Mortgage that was taken out on this home.
Original Mortgage
$204,250
Interest Rate
5.5%
Create a Home Valuation Report for This Property
The Home Valuation Report is an in-depth analysis detailing your home's value as well as a comparison with similar homes in the area
Home Values in the Area
Average Home Value in this Area
Purchase History
| Date | Buyer | Sale Price | Title Company |
|---|---|---|---|
| Tamse Melba L | -- | None Available | |
| Tamse Melba L | $42,100 | First American Title Guarant | |
| Tamse Melba L | $215,000 | Fidelity National Title |
Source: Public Records
Mortgage History
| Date | Status | Borrower | Loan Amount |
|---|---|---|---|
| Open | Tamse Melba L | $210,500 | |
| Previous Owner | Tamse Melba L | $204,250 |
Source: Public Records
Tax History Compared to Growth
Tax History
| Year | Tax Paid | Tax Assessment Tax Assessment Total Assessment is a certain percentage of the fair market value that is determined by local assessors to be the total taxable value of land and additions on the property. | Land | Improvement |
|---|---|---|---|---|
| 2025 | $4,630 | $342,644 | $101,111 | $248,533 |
| 2024 | $4,630 | $335,790 | $99,129 | $243,661 |
| 2023 | $4,491 | $336,070 | $97,186 | $238,884 |
| 2022 | $4,416 | $322,481 | $95,280 | $234,201 |
| 2021 | $4,309 | $316,022 | $93,412 | $229,610 |
| 2020 | $4,203 | $319,709 | $92,454 | $227,255 |
| 2019 | $4,145 | $313,442 | $90,642 | $222,800 |
| 2018 | $4,079 | $307,297 | $88,865 | $218,432 |
| 2017 | $3,974 | $301,273 | $87,123 | $214,150 |
| 2016 | $3,922 | $295,367 | $85,415 | $209,952 |
| 2015 | $3,907 | $290,931 | $84,132 | $206,799 |
| 2014 | $3,797 | $285,232 | $82,484 | $202,748 |
Source: Public Records
Map
Nearby Homes
- 5669 Civic Terrace Ave
- 36630 Hafner St
- 36931 Newark Blvd Unit E
- 6198 Civic Terrace Ave Unit A
- 6234 Zulmida Ave
- 37088 Arden St
- 6189 Thornton Ave Unit C
- 5879 Caleb Ct
- 6025 Radcliffe Ave
- 36593 Leone St
- 6433 Thornton Ave
- 6364 Noel Ave
- 6176 Thomas Ave
- 36109 Dalewood Dr
- 36976 Mulberry St
- 36720 Charles St
- 36686 Charles St
- 36523 Cherry St
- 5113 Dupont Ave
- 37659 Granville Dr
- 36865 Munyan St
- 36894 Hafner St
- 36853 Munyan St
- 5756 Souza Ave
- 5746 Souza Ave
- 36890 Munyan St
- 5766 Souza Ave
- 36884 Hafner St
- 36876 Munyan St
- 36841 Munyan St
- 5736 Souza Ave
- 36866 Munyan St
- 5776 Souza Ave
- 36854 Munyan St
- 36874 Hafner St
- 5726 Souza Ave
- 36829 Munyan St
- 36842 Munyan St
- 5786 Souza Ave
- 36864 Hafner St