NOT LISTED FOR SALE

369 Carleton Cir Spartanburg, SC 29301

Estimated Value: $469,616 - $565,000

4 Beds
4 Baths
2,424 Sq Ft
$212/Sq Ft Est. Value

Last Sold September 14, 2012

Last sale price $255,000 $105 Per Sq Ft

Est. 102% increase in value since last sale

Current estimated payment $2,836/month

About This Home

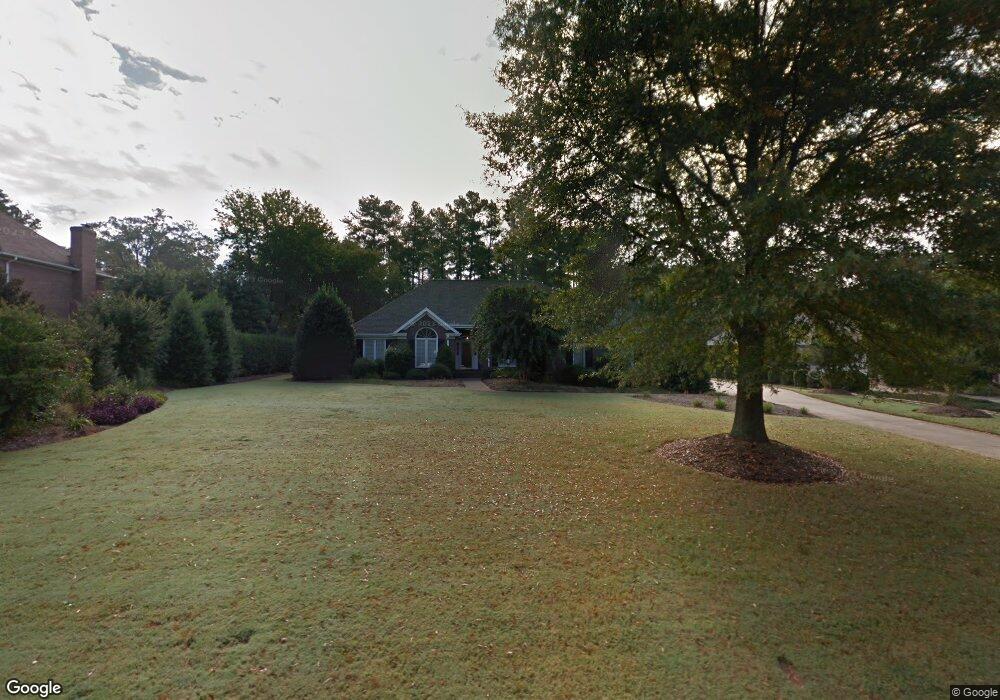
This home is located at 369 Carleton Cir, Spartanburg, SC 29301 and is currently estimated at $513,904, approximately $212 per square foot. 369 Carleton Cir is a home located in Spartanburg County with nearby schools including Dorman High School Freshman Campus, Dorman High School, and Fine Arts Preparatory School.

Ownership History

Date Name Owned For Owner Type

Purchase Details

Listed on
Jul 27, 2012
Closed on
Sep 12, 2012
Sold by
Lindsey Charles R and Lindsey Diane S
Bought by
Rickenbacker Thomas M and Rickenbaker Cynthia G
Seller's Agent
Annette Starnes
Coldwell Banker Caine Real Est
Buyer's Agent
LISA MAGEE
OTHER
List Price
$295,000
Sold Price
$255,000
Premium/Discount to List
-$40,000
-13.56%
Current Estimated Value
$513,904

Home Financials for this Owner

Home Financials are based on the most recent Mortgage that was taken out on this home.
Estimated Appreciation
$258,904
Avg. Annual Appreciation
5.48%

Purchase Details

Closed on
Jul 13, 2000
Sold by
Davis Tommy M
Bought by
Lindsey Charles R and Lindsey Diane S

Purchase Details

Closed on
May 14, 1999
Sold by
Lewis Christine
Bought by
Davis Tommy
Source: Public Records

Range of Values:

Collateral Analytics

Collateral Analytics Collateral Analytics AVMs (Automated Valuation Model) employ a number of statistical approaches combined with neighborhood-specific comparable selection guarantees the most up-to-date and precise valuations.

Not Available

Collateral Analytics does not have data for the current month. Please view the chart for historical values.

ICE

ICE Mortgage Technology ICE Mortgage Technology’s AVM (Automated Valuation Model) is a state-of-the-art online residential property valuation tool that provides a quick and accurate estimate of the value of almost any home in the U.S.

Not Available

ICE Mortgage Technology does not have data for the current month. Please view the chart for historical values.

First American

First American First American Data & Analytics’ next-generation AVM combines unrivaled data assets with a blended ensemble of valuation models to produce highly accurate, reliable valuations you can trust.

Not Available

First American does not have data for the current month. Please view the chart for historical values.

Quantarium

Quantarium Quantarium’s valuation service, repeatedly proven the industry’s most accurate and comprehensive, is supercharged with a self-learning and auto-tuning AI engine that continually becomes smarter and more accurate as it processes daily inputs from the industry’s leading RE data lake.

Not Available

Quantarium does not have data for the current month. Please view the chart for historical values.

Average Value
Not Available
List Price
Sold Price
Create a Home Valuation Report for This Property
The Home Valuation Report is an in-depth analysis detailing your home's value as well as a comparison with similar homes in the area

Home Values in the Area

Source: Public Records

Average Home Value in this Area


Source: Public Records

Purchase History

Date Buyer Sale Price Title Company
Rickenbacker Thomas M $255,000 --
Lindsey Charles R $247,000 --
Davis Tommy $229,000 --
Source: Public Records

Property History

Date Event Price List to Sale Price per Sq Ft Prior Sale
09/14/2012 09/14/12 Sold $255,000 -13.6% $105 / Sq Ft View Prior Sale
08/14/2012 08/14/12 Pending -- -- --
07/27/2012 07/27/12 For Sale $295,000 -- $122 / Sq Ft

Tax History Compared to Growth

Source: Public Records

Tax History

Year Tax Paid Tax Assessment Tax Assessment Total Assessment is a certain percentage of the fair market value that is determined by local assessors to be the total taxable value of land and additions on the property. Land Improvement
2025 $1,754 $12,476 $1,965 $10,511
2024 $1,754 $12,476 $1,965 $10,511
2023 $1,754 $12,476 $1,965 $10,511
2022 $1,579 $10,848 $2,000 $8,848
2021 $1,579 $10,848 $2,000 $8,848
2020 $1,541 $10,848 $2,000 $8,848
2019 $1,860 $10,848 $2,000 $8,848
2018 $1,844 $10,848 $2,000 $8,848
2017 $1,729 $10,360 $1,800 $8,560
2016 $1,693 $10,360 $1,800 $8,560
2015 $1,710 $10,360 $1,800 $8,560
2014 $5,338 $15,540 $2,700 $12,840
Source: Public Records

Agents Affiliated with this Home

  • Section Image
See All Agents

Map